Retail Space
3601 Chichester Avenue Boothwyn, PA 19061
3601 Chichester Avenue Boothwyn, PA 19061
Details & Description
Property Highlights
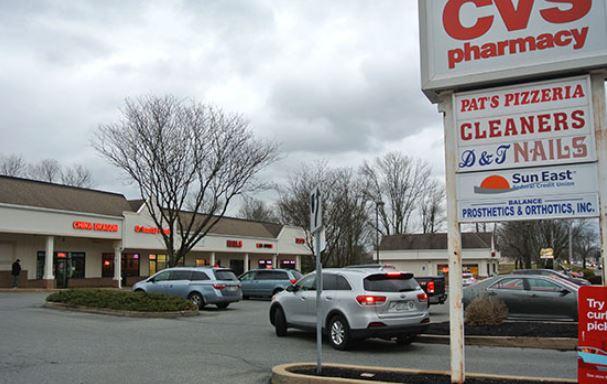
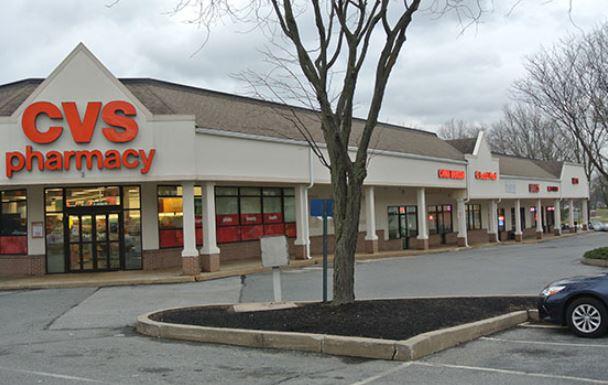
• Positioned equidistant from Rt. 322 and I-95 providing local and regional access
• Ample Parking with multiple entry points from a fully signalized intersection
Listing Agents

Joe Raniszewski
O: 215-883-7390
jraniszewski@hellomsc.com
O: 215-883-7390
jraniszewski@hellomsc.com

Leah Sweitzer
MSC
O: 310-622-4532
lsweitzer@hellomsc.com
MSC
O: 310-622-4532
lsweitzer@hellomsc.com
While we strive to provide the most accurate information, all listing information, and demographic data, is provided by third-parties. As such, MyEListing will not be responsible for the accuracy of the information. It is strongly recommended that you verify all information with the listing agent, and any relevant agencies, prior to making any decisions.