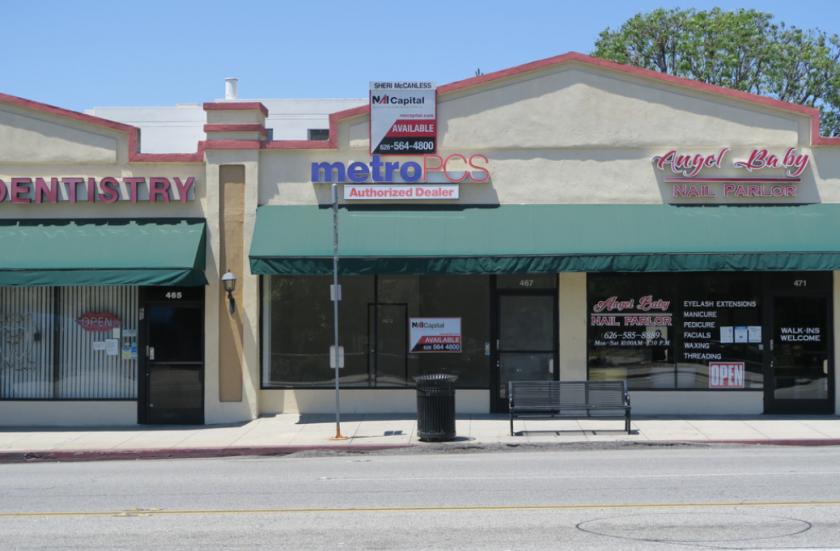
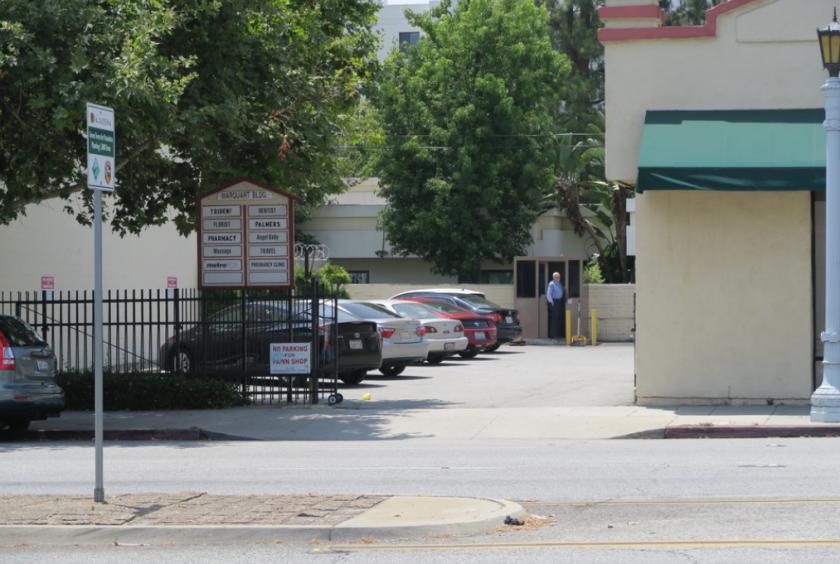
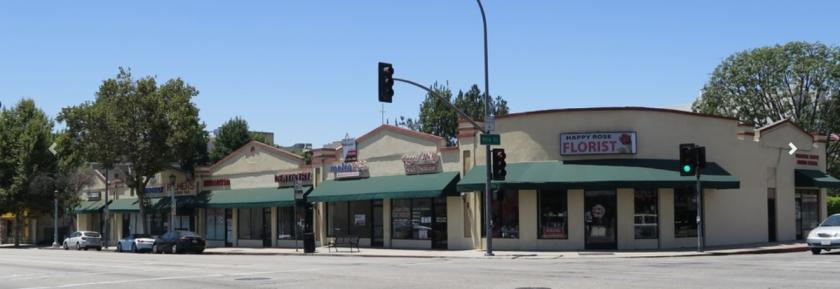
1-Mile | 3-Miles | 5-Miles | ||
---|---|---|---|---|
Total Population | 42,935 | 184,580 | 455,994 | |
Population Median Age | 37 | 40 | 40 | |
Population by Age | 0-9 Yrs | 4910 (11%) | 20338 (11%) | 50694 (11%) |
10-19 Yrs | 3672 (8%) | 17887 (9%) | 47030 (10%) | |
20-29 Yrs | 8335 (19%) | 26603 (14%) | 62497 (13%) | |
30-39 Yrs | 7980 (18%) | 28103 (15%) | 66123 (14%) | |
40-49 Yrs | 5662 (13%) | 26449 (14%) | 65348 (14%) | |
50-59 Yrs | 5134 (11%) | 24398 (13%) | 62208 (13%) | |
60-69 Yrs | 3547 (8%) | 19943 (10%) | 50331 (11%) | |
70+ Yrs | 3695 (8%) | 20860 (11%) | 51763 (11%) | |
Median HH Income | $65,001 | $87,756 | $83,847 | |
Total Household Income | < 24K | 4585 (25%) | 12135 (17%) | 26897 (16%) |
25-49K | 2593 (14%) | 8894 (12%) | 24147 (14%) | |
50-74K | 2749 (15%) | 9665 (13%) | 23861 (14%) | |
75-99K | 2203 (12%) | 8798 (12%) | 19730 (12%) | |
100-199K | 3921 (22%) | 19552 (27%) | 44229 (27%) | |
200K+ | 1647 (9%) | 11323 (16%) | 24912 (15%) | |
Highest Education Level | No Diploma | 4817 | 15195 | 40996 |
Diploma or GED | 4986 | 18599 | 53418 | |
Some College | 4666 | 21871 | 54434 | |
Assoc. Degree | 1915 | 8559 | 23650 | |
Bachelors Degree | 8303 | 37966 | 92451 | |
Higher Degree | 6938 | 34013 | 67907 | |
Total Housing Units | 19,657 | 78,257 | 179,064 | |
--Owner-Occupied | 4,010 | 32,437 | 81,462 | |
--Renter-Occupied | 13,689 | 37,928 | 82,313 | |
Owner-Occupied Values | < 100K | 46 | 347 | 1004 |
100-199K | 10 | 250 | 558 | |
200-299K | 88 | 330 | 958 | |
300-399K | 302 | 1305 | 3385 | |
400-499K | 576 | 2284 | 5977 | |
500K+ | 2988 | 27920 | 69581 | |
Total Working Age Population | 35,946 | 153,526 | 377,461 | |
In Work Force | 24,535 | 100,349 | 242,860 | |
Not In Work Force | 11,411 | 53,176 | 134,601 | |
Workforce Employed | 23,471 | 96,095 | 231,157 | |
Workforce Unemployed | 1,049 | 4,217 | 11,611 | |
Civlian Workforce | 24,520 | 100,312 | 242,768 | |
Military Workforce | 15 | 37 | 91 | |
Total Households | 17,698 | 70,365 | 163,775 | |
Family Households | 8,533 | 42,191 | 107,439 | |
Non-Family Households | 9,165 | 28,174 | 56,336 | |
Married Couple | 5,926 | 31,427 | 77,895 | |
Other Family | 2,607 | 10,764 | 29,544 | |
Married w/Child | 2,345 | 12,274 | 31,618 | |
Single Male w/Child | 283 | 1,192 | 3,141 | |
Single Female w/Child | 838 | 2,900 | 7,356 |
Population Change Last Two Decades - Plus Projection
2000 | % | 2010 | % | 2020 | % | 2030 | |
---|---|---|---|---|---|---|---|
California | 33,871,648 | +10 | 37,253,956 | +9 | 40,467,295 | +8 | 43,631,295 |
Los Angeles County | 9,519,338 | +3 | 9,818,605 | +6 | 10,369,367 | +4 | 10,759,850 |
Total Working Age Population:
Total Households:
Total Working Age Population:
Total Households:
Total Working Age Population:
Total Households: