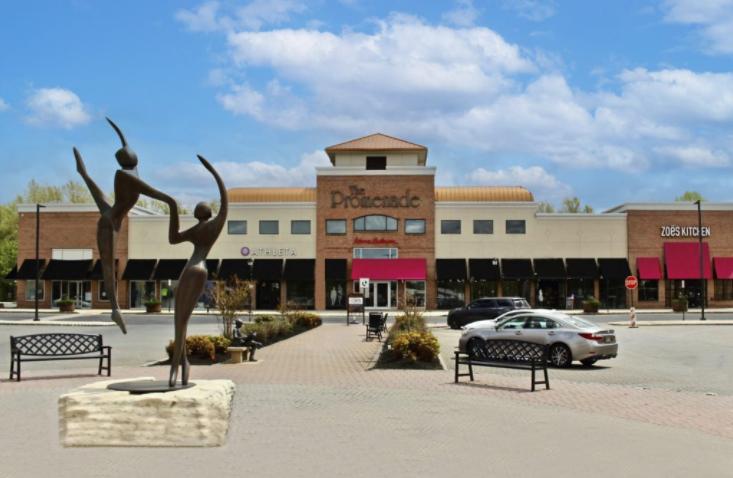
Situated in the heart of Southern New Jersey’s densest and most affluent trade area, The Promenade at Sagemore is unequivocally the premier and most desirable shopping destination within a 45-minute drive-time.
With the rare combination of local residential accessibility and regional draw, coupled with substantial corporate daytime business in close proximity, the center’s location pulls an incredibly diverse shopper– from daily needs visits and destination shopping, to power lunches and weekend dining.
A critical market strategy position for any high-end lifestyle tenant entering or expanding within the Philadelphia MSA, the Marlton trade area serves the entirety of Southern New Jersey while providing optimal spacing from other key lifestyle centers in the region.
Unique tenant mix of retail and restaurants that truly differentiates the shopping experience from other nearby centers and malls with more ubiquitous brands and tenants.
Meticulously manicured common areas and plentiful outdoor space creates an optimal environment for an open-air, ‘urban-like’ shopping experience in the suburbs.
No part of this information may be copied, reproduced, repurposed, or screen-captured for any commercial purpose without prior written authorization from MyEListing.
While we strive to provide the most accurate information, all listing information, and demographic data, is provided by third-parties. As such, MyEListing will not be responsible for the accuracy of the information. It is strongly recommended that you verify all information with the listing agent, and any relevant agencies, prior to making any decisions.
What is the building size of this commercial Retail property?
The size of this lease property at '.500 New Jersey 73.' is 1200 square feet
What kind of Retail is the propery at 500 New Jersey 73?
The property at 500 New Jersey 73 Evesham, NJ 08053 is listed as a Shopping Center Retail property
What is the population within 1 mile of 500 New Jersey 73 in Evesham?
The population within 1 mile of 500 New Jersey 73 Evesham, NJ 08053 is 9,067 people.
Who do I contact for questions about 500 New Jersey 73?
You should contact the listing agent,
Douglas Green, for any details regarding this commercial listing.