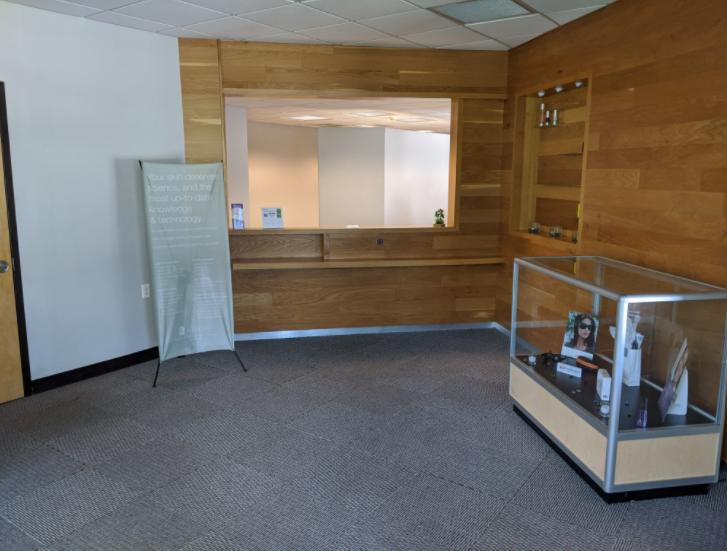
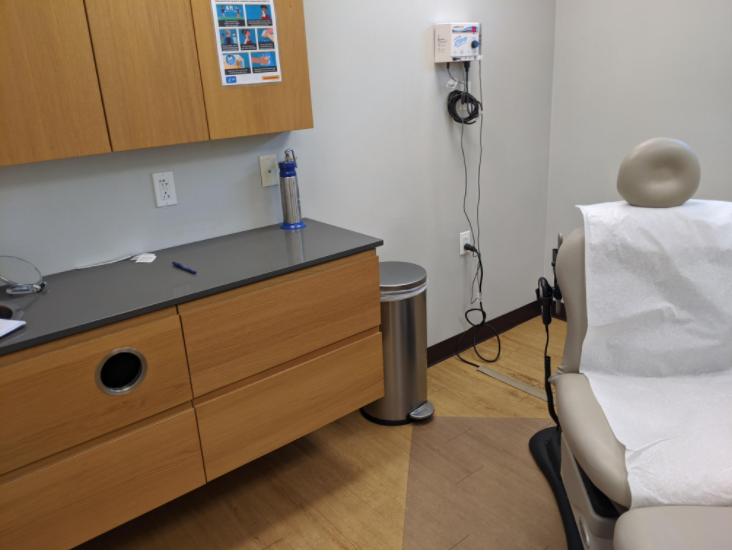
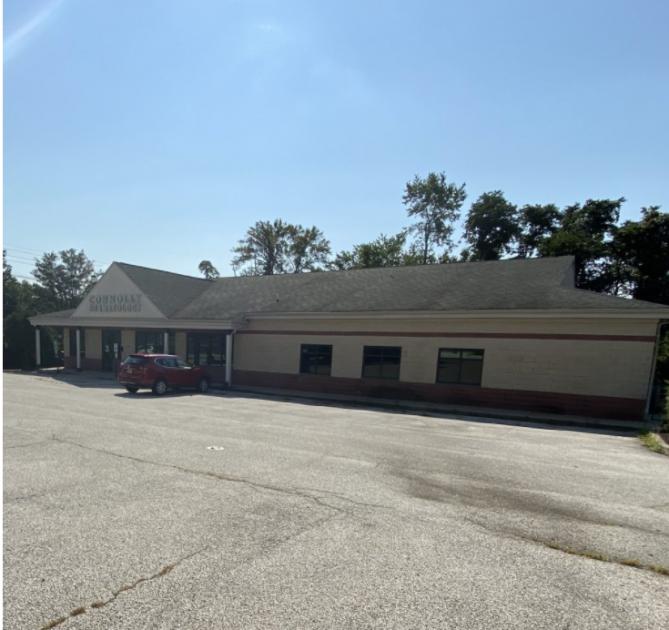
1-Mile | 3-Miles | 5-Miles | ||
---|---|---|---|---|
Total Population | 8,796 | 66,888 | 281,353 | |
Population Median Age | 39 | 41 | 39 | |
Population by Age | 0-9 Yrs | 923 (10%) | 6771 (10%) | 34449 (12%) |
10-19 Yrs | 1148 (13%) | 7819 (11%) | 33626 (11%) | |
20-29 Yrs | 1211 (13%) | 8964 (13%) | 37413 (13%) | |
30-39 Yrs | 1131 (12%) | 8030 (12%) | 40310 (14%) | |
40-49 Yrs | 1190 (13%) | 8913 (13%) | 35084 (12%) | |
50-59 Yrs | 1364 (15%) | 10754 (16%) | 40126 (14%) | |
60-69 Yrs | 960 (10%) | 7721 (11%) | 31197 (11%) | |
70+ Yrs | 869 (9%) | 7916 (11%) | 29149 (10%) | |
Median HH Income | $94,432 | $87,183 | $67,084 | |
Total Household Income | < 24K | 273 (8%) | 2922 (11%) | 17512 (16%) |
25-49K | 404 (12%) | 3569 (14%) | 21357 (20%) | |
50-74K | 571 (17%) | 4218 (17%) | 19213 (18%) | |
75-99K | 503 (15%) | 3282 (13%) | 13823 (13%) | |
100-199K | 1159 (35%) | 7253 (29%) | 25025 (23%) | |
200K+ | 368 (11%) | 3373 (13%) | 8014 (7%) | |
Highest Education Level | No Diploma | 265 | 3443 | 19241 |
Diploma or GED | 1532 | 13758 | 69130 | |
Some College | 1107 | 7960 | 36002 | |
Assoc. Degree | 558 | 4027 | 15489 | |
Bachelors Degree | 1823 | 11811 | 37016 | |
Higher Degree | 854 | 6744 | 19731 | |
Total Housing Units | 3,555 | 26,830 | 113,962 | |
--Owner-Occupied | 2,249 | 18,419 | 71,087 | |
--Renter-Occupied | 1,028 | 6,197 | 33,857 | |
Owner-Occupied Values | < 100K | 25 | 678 | 6519 |
100-199K | 196 | 5140 | 32148 | |
200-299K | 1307 | 6856 | 19419 | |
300-399K | 546 | 2869 | 6518 | |
400-499K | 66 | 884 | 2255 | |
500K+ | 110 | 1992 | 4229 | |
Total Working Age Population | 7,188 | 55,534 | 226,812 | |
In Work Force | 5,126 | 35,460 | 146,360 | |
Not In Work Force | 2,062 | 20,074 | 80,452 | |
Workforce Employed | 4,759 | 33,608 | 136,017 | |
Workforce Unemployed | 352 | 1,737 | 10,082 | |
Civlian Workforce | 5,112 | 35,345 | 146,099 | |
Military Workforce | 15 | 115 | 261 | |
Total Households | 3,278 | 24,616 | 104,944 | |
Family Households | 2,330 | 16,993 | 68,924 | |
Non-Family Households | 948 | 7,623 | 36,020 | |
Married Couple | 1,868 | 13,176 | 47,311 | |
Other Family | 462 | 3,817 | 21,613 | |
Married w/Child | 813 | 4,881 | 18,690 | |
Single Male w/Child | 33 | 452 | 2,662 | |
Single Female w/Child | 188 | 1,290 | 7,584 |
Population Change Last Two Decades - Plus Projection
2000 | % | 2010 | % | 2020 | % | 2030 | |
---|---|---|---|---|---|---|---|
New Jersey | 8,414,350 | +4 | 8,791,894 | +4 | 9,132,700 | +4 | 9,530,900 |
Burlington County | 423,394 | +6 | 448,734 | 0 | 450,000 | +3 | 464,900 |
Camden County | 508,932 | +1 | 513,657 | 0 | 511,800 | +2 | 521,000 |
Pennsylvania | 12,281,054 | +3 | 12,702,379 | +4 | 13,230,170 | +4 | 13,759,594 |
Bucks County | 597,635 | +5 | 625,249 | +1 | 629,420 | +1 | 637,730 |
Montgomery County | 750,097 | +7 | 799,874 | +5 | 838,883 | +6 | 891,868 |
Philadelphia County | 1,517,550 | +1 | 1,526,006 | +8 | 1,653,729 | +6 | 1,753,054 |
Total Working Age Population:
Total Households:
Total Working Age Population:
Total Households:
Total Working Age Population:
Total Households: