Commercial Land
500 Berlin - Cross Keys Road Sicklerville, NJ 08081
500 Berlin - Cross Keys Road Sicklerville, NJ 08081
Details & Description
Property Highlights
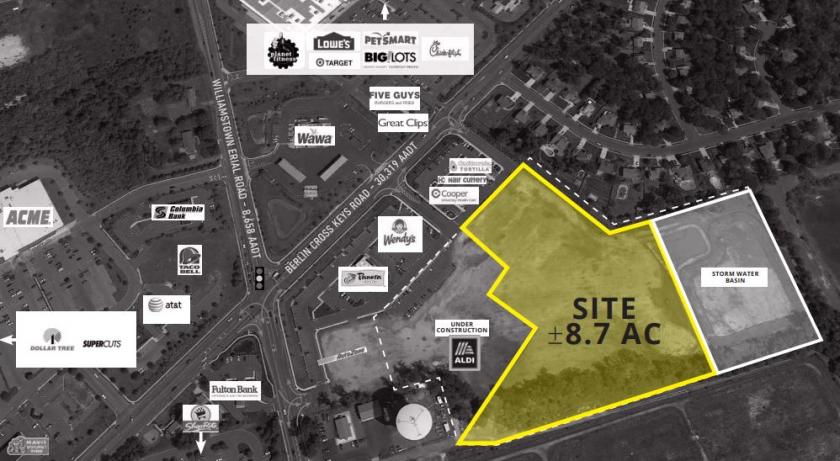
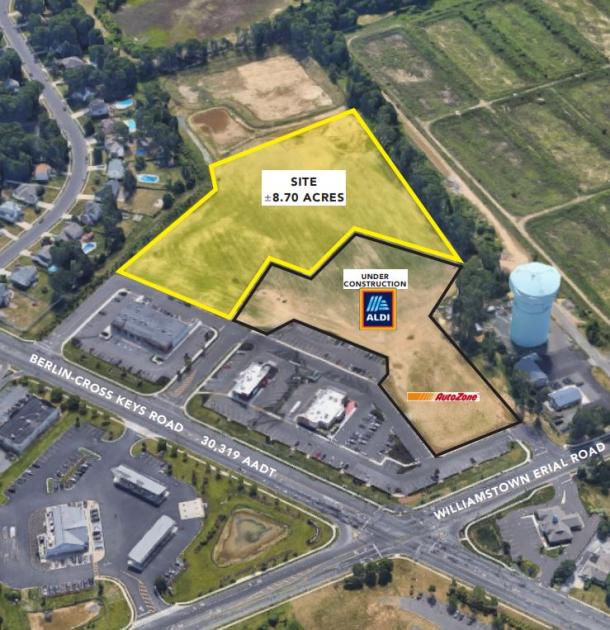
• Full access to Berlin Cross Keys Road 30,319 AADT and Williamstown Erial Road
• Within 3 miles and over 150,000 within 5 miles
Listing Agents

Jason Bock
O: 215-883-7403
jbock@hellomsc.com
O: 215-883-7403
jbock@hellomsc.com

Leah Sweitzer
MSC
O: 310-622-4532
lsweitzer@hellomsc.com
MSC
O: 310-622-4532
lsweitzer@hellomsc.com
While we strive to provide the most accurate information, all listing information, and demographic data, is provided by third-parties. As such, MyEListing will not be responsible for the accuracy of the information. It is strongly recommended that you verify all information with the listing agent, and any relevant agencies, prior to making any decisions.