Industrial Properties
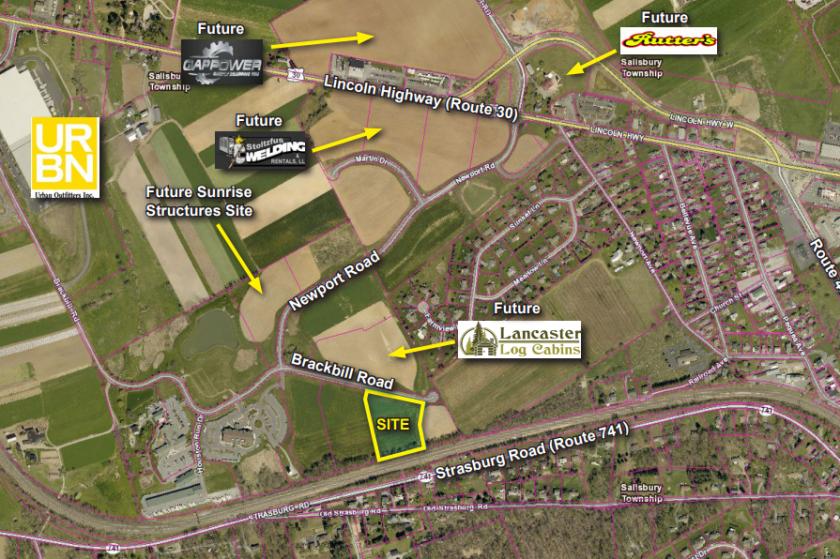
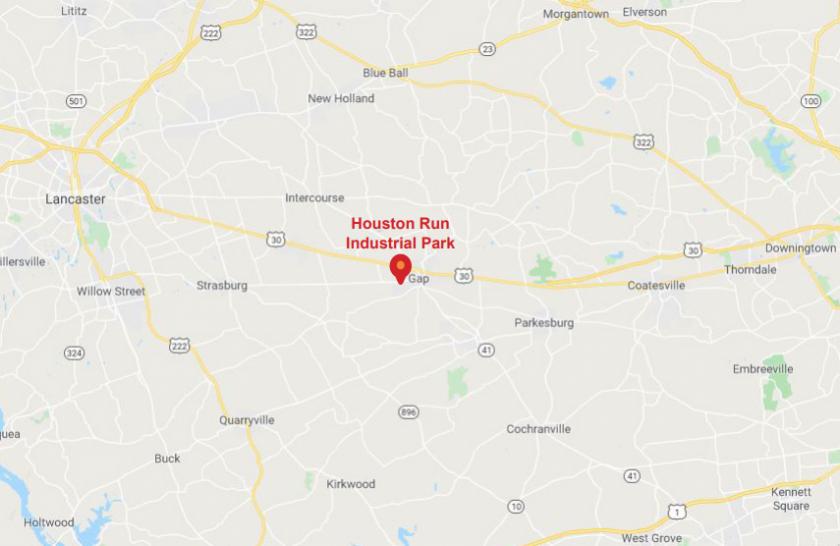
5223 Old Strasburg Rd Kinzers, PA 17535
5223 Old Strasburg Rd Kinzers, PA 17535
Details & Description
Property Highlights
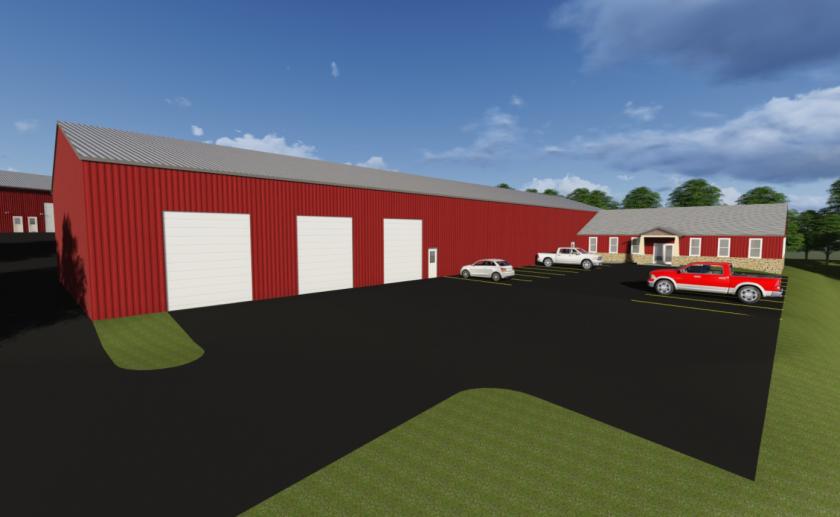
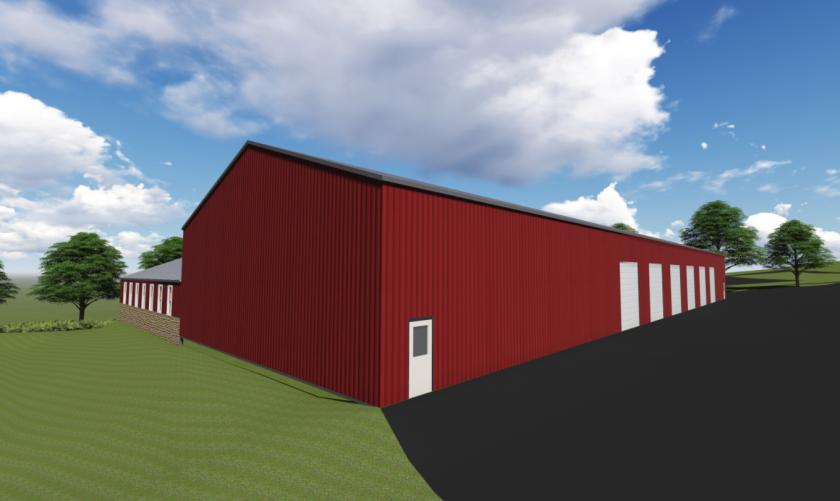
- • Nine 9 12 x 14 grade level doors
- • 20 ceiling heights in warehouse
- • LOT SIZE 1.65 Acres
Additional Photos
Listing Agents

Scott Bradbury
O: 717-735-6000
scott@uscommercialrealty.net
O: 717-735-6000
scott@uscommercialrealty.net
While we strive to provide the most accurate information, all listing information, and demographic data, is provided by third-parties. As such, MyEListing will not be responsible for the accuracy of the information. It is strongly recommended that you verify all information with the listing agent, and any relevant agencies, prior to making any decisions.


