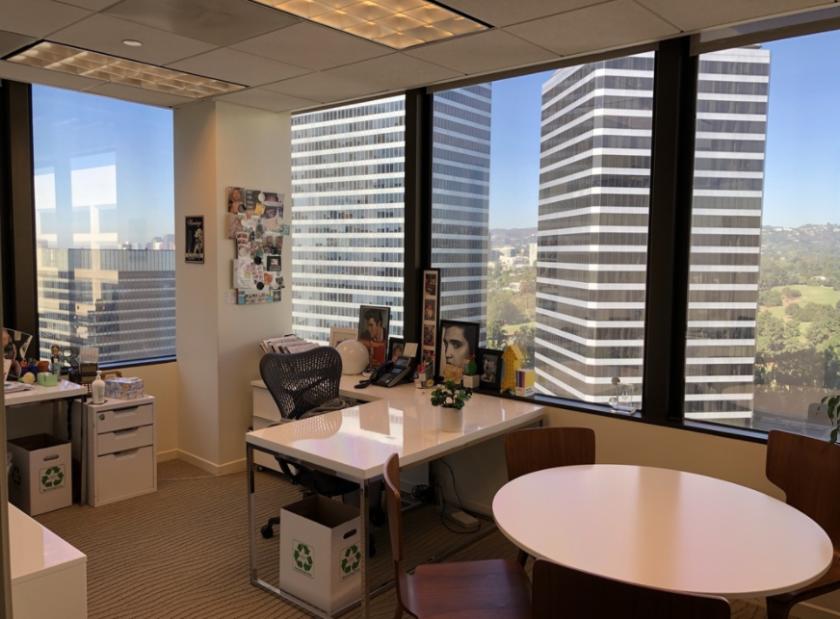
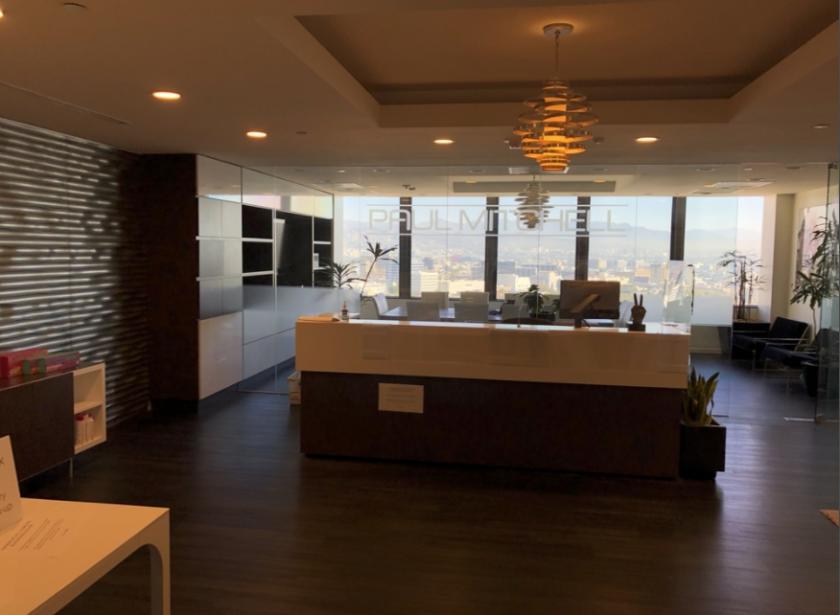
1-Mile | 3-Miles | 5-Miles | ||
---|---|---|---|---|
Total Population | 24,997 | 280,954 | 667,242 | |
Population Median Age | 45 | 38 | 39 | |
Population by Age | 0-9 Yrs | 2569 (10%) | 22438 (7%) | 57072 (8%) |
10-19 Yrs | 1942 (7%) | 29543 (10%) | 62130 (9%) | |
20-29 Yrs | 2671 (10%) | 60765 (21%) | 124762 (18%) | |
30-39 Yrs | 3464 (13%) | 50601 (18%) | 121559 (18%) | |
40-49 Yrs | 3068 (12%) | 34929 (12%) | 93170 (13%) | |
50-59 Yrs | 3433 (13%) | 28976 (10%) | 77264 (11%) | |
60-69 Yrs | 3022 (12%) | 24960 (8%) | 63878 (9%) | |
70+ Yrs | 4827 (19%) | 28742 (10%) | 67407 (10%) | |
Median HH Income | $109,034 | $87,880 | $83,586 | |
Total Household Income | < 24K | 1885 (15%) | 20123 (16%) | 50095 (16%) |
25-49K | 1334 (11%) | 17064 (13%) | 44701 (14%) | |
50-74K | 1159 (9%) | 16982 (13%) | 42146 (14%) | |
75-99K | 1236 (10%) | 14954 (12%) | 35687 (11%) | |
100-199K | 3045 (25%) | 31983 (25%) | 74563 (24%) | |
200K+ | 3285 (27%) | 22643 (18%) | 51208 (17%) | |
Highest Education Level | No Diploma | 570 | 10931 | 41031 |
Diploma or GED | 1693 | 18975 | 54894 | |
Some College | 2886 | 29329 | 79147 | |
Assoc. Degree | 976 | 9984 | 26404 | |
Bachelors Degree | 7028 | 74370 | 173893 | |
Higher Degree | 6355 | 57209 | 121303 | |
Total Housing Units | 14,194 | 140,109 | 331,116 | |
--Owner-Occupied | 5,675 | 40,205 | 100,109 | |
--Renter-Occupied | 6,270 | 83,543 | 198,291 | |
Owner-Occupied Values | < 100K | 42 | 586 | 1527 |
100-199K | 64 | 326 | 736 | |
200-299K | 57 | 391 | 1399 | |
300-399K | 35 | 683 | 2950 | |
400-499K | 82 | 1292 | 4197 | |
500K+ | 5395 | 36928 | 89300 | |
Total Working Age Population | 21,125 | 246,398 | 577,230 | |
In Work Force | 13,212 | 165,184 | 400,537 | |
Not In Work Force | 7,913 | 81,214 | 176,692 | |
Workforce Employed | 12,633 | 156,500 | 379,132 | |
Workforce Unemployed | 579 | 8,565 | 21,030 | |
Civlian Workforce | 13,212 | 165,066 | 400,162 | |
Military Workforce | 0 | 118 | 376 | |
Total Households | 11,945 | 123,748 | 298,400 | |
Family Households | 5,829 | 52,045 | 132,454 | |
Non-Family Households | 6,115 | 71,703 | 165,945 | |
Married Couple | 4,710 | 40,401 | 99,763 | |
Other Family | 1,120 | 11,643 | 32,691 | |
Married w/Child | 1,640 | 15,723 | 39,400 | |
Single Male w/Child | 190 | 1,359 | 3,916 | |
Single Female w/Child | 318 | 3,150 | 8,684 |
Population Change Last Two Decades - Plus Projection
2000 | % | 2010 | % | 2020 | % | 2030 | |
---|---|---|---|---|---|---|---|
California | 33,871,648 | +10 | 37,253,956 | +9 | 40,467,295 | +8 | 43,631,295 |
Los Angeles County | 9,519,338 | +3 | 9,818,605 | +6 | 10,369,367 | +4 | 10,759,850 |
Total Working Age Population:
Total Households:
Total Working Age Population:
Total Households:
Total Working Age Population:
Total Households: