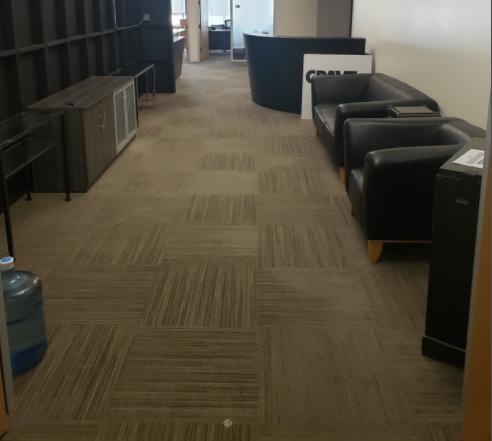
Office Space
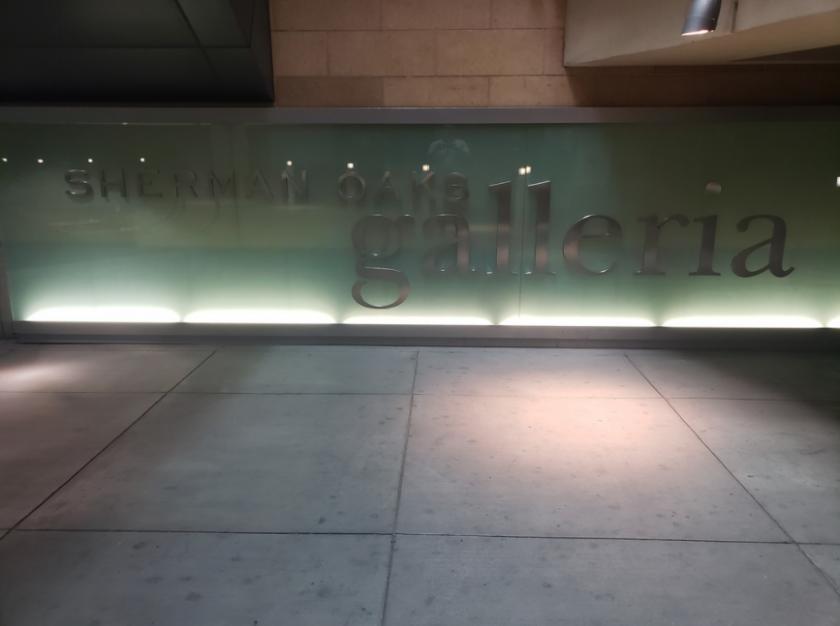
15301 Ventura Boulevard Los Angeles, CA 91403
15301 Ventura Boulevard Los Angeles, CA 91403
Details & Description
Property Highlights
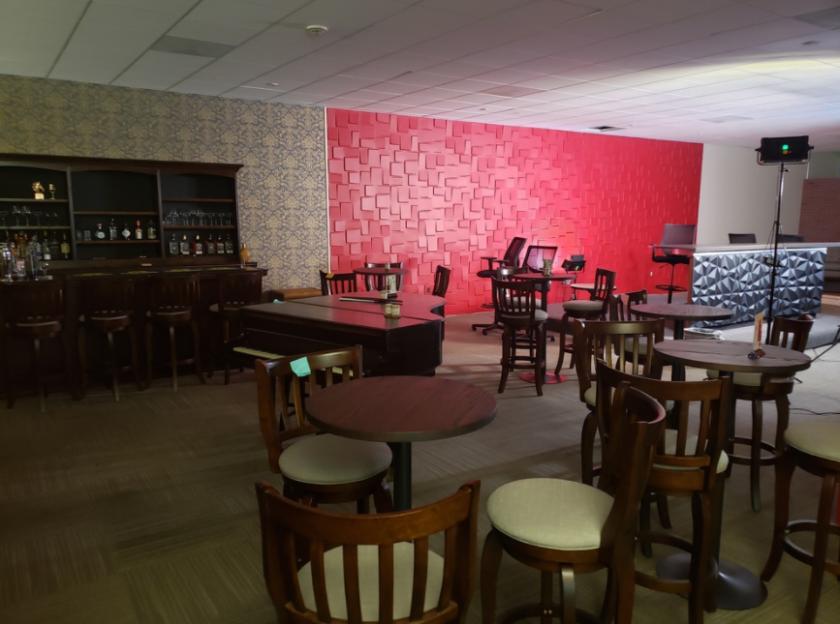
- • Large stage area- former news company suite
- • No elevators
- • Ground floor space
- • 10 private offices and 1 conference room
- • Security at entrance
Listing Agents

Michael Arnold
O: 310-806-6130
M: 310-694-4550
marnold@naicapital.com
O: 310-806-6130
M: 310-694-4550
marnold@naicapital.com
While we strive to provide the most accurate information, all listing information, and demographic data, is provided by third-parties. As such, MyEListing will not be responsible for the accuracy of the information. It is strongly recommended that you verify all information with the listing agent, and any relevant agencies, prior to making any decisions.