Office Space
711 West College Street Los Angeles, CA 90012
711 West College Street Los Angeles, CA 90012
Details & Description
Property Highlights
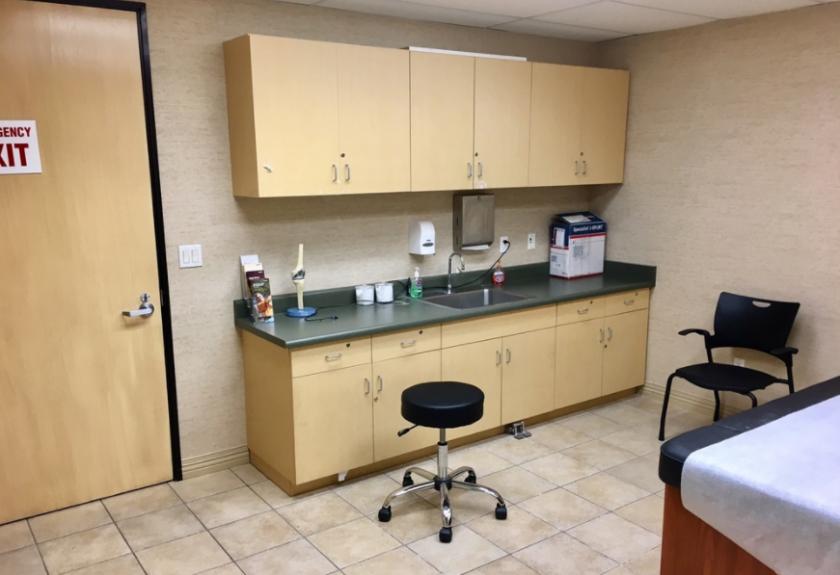
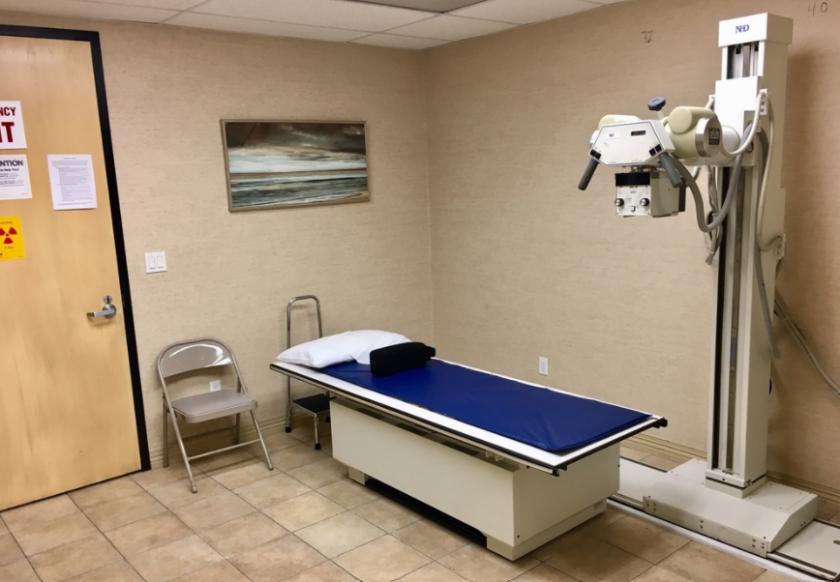
- • 8 Windowed Exam Rooms
- • 1 Interior Exam Room
- • Windowed Private Office
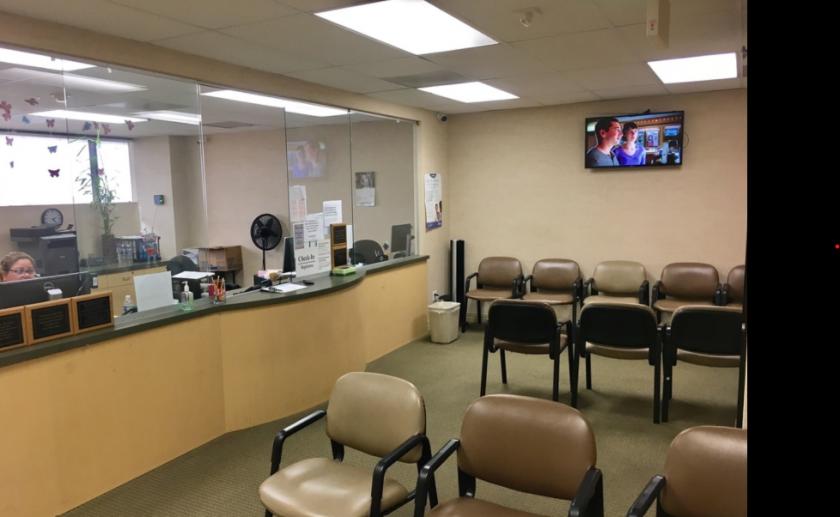
- • Large Enclosed Reception off Elevator
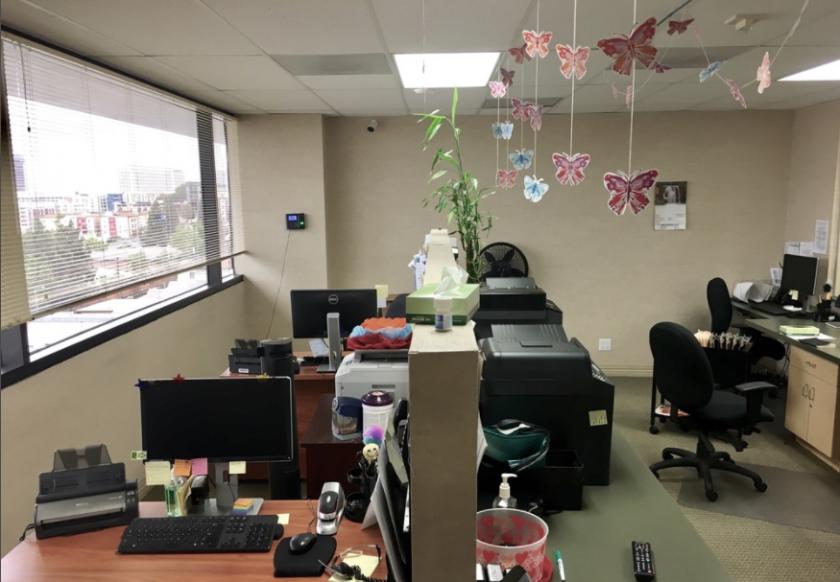
- • Staff Bullpen
- • Private Restroom
Additional Photos
Listing Agents

Chris Runyen
O: 213-632-7715
crunyen@naicapital.com
O: 213-632-7715
crunyen@naicapital.com
While we strive to provide the most accurate information, all listing information, and demographic data, is provided by third-parties. As such, MyEListing will not be responsible for the accuracy of the information. It is strongly recommended that you verify all information with the listing agent, and any relevant agencies, prior to making any decisions.


