Commercial Land
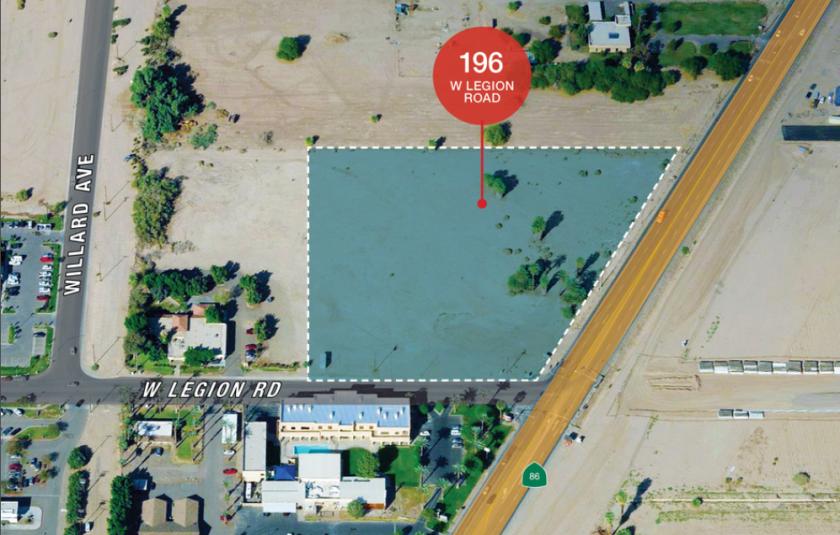
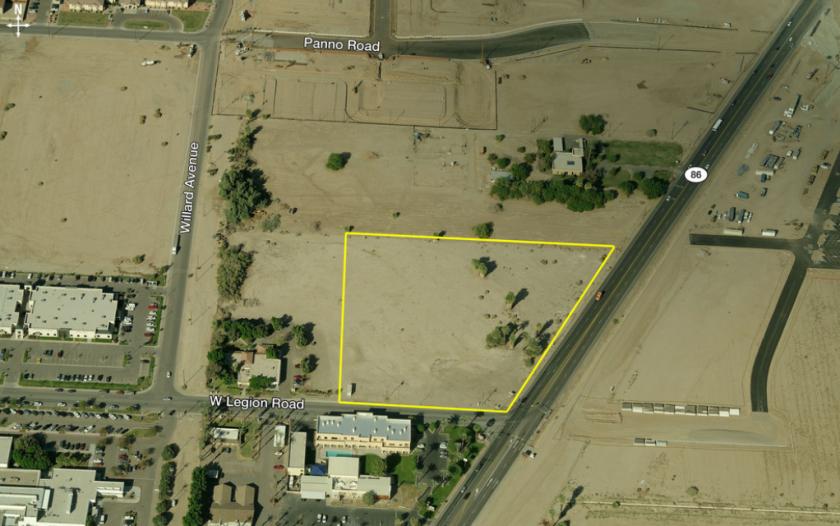
196 West Legion Road Brawley, CA 92227
196 West Legion Road Brawley, CA 92227
Details & Description
Property Highlights
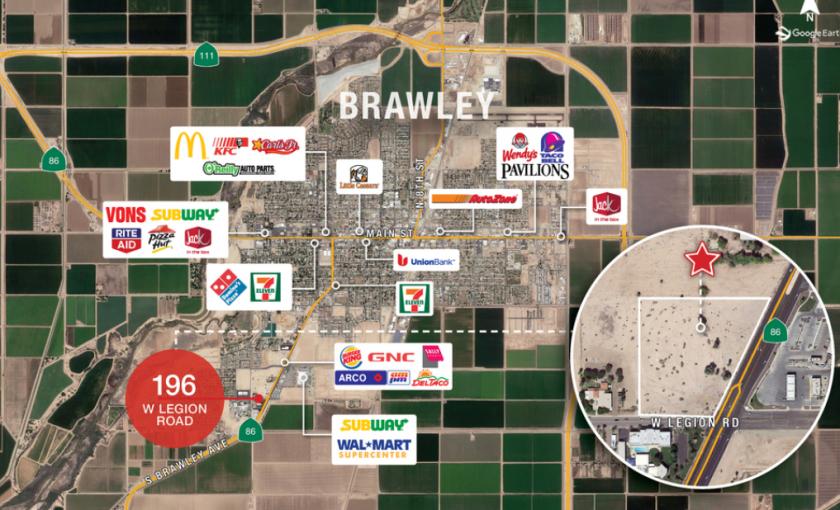
• Site within the retail hub for surrounding cities, including Calipatria, El Centro, Calexico, and Westmoreland
• Permitted Uses Retail Stores, Banks, Offices, Drug Store, Restaurant check with City for intended use
Listing Agents

Geri Armstrong
O: 310-878-6893
M: 310-850-9760
garmstrong@naicapital.com
O: 310-878-6893
M: 310-850-9760
garmstrong@naicapital.com
While we strive to provide the most accurate information, all listing information, and demographic data, is provided by third-parties. As such, MyEListing will not be responsible for the accuracy of the information. It is strongly recommended that you verify all information with the listing agent, and any relevant agencies, prior to making any decisions.