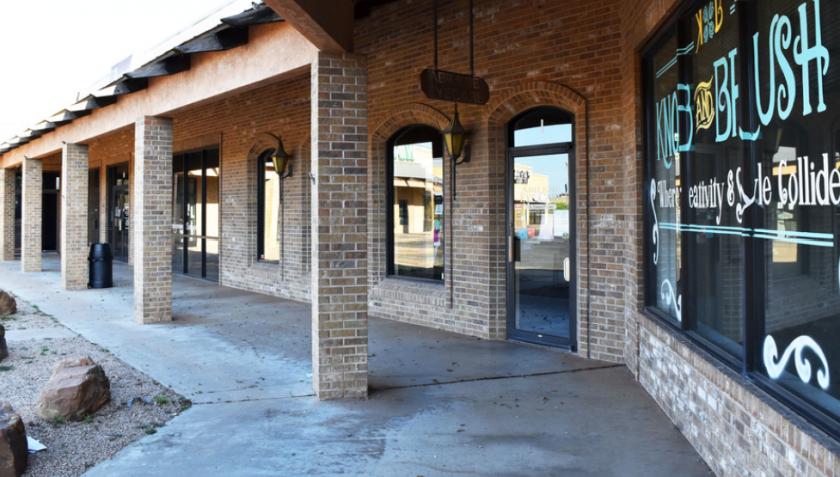
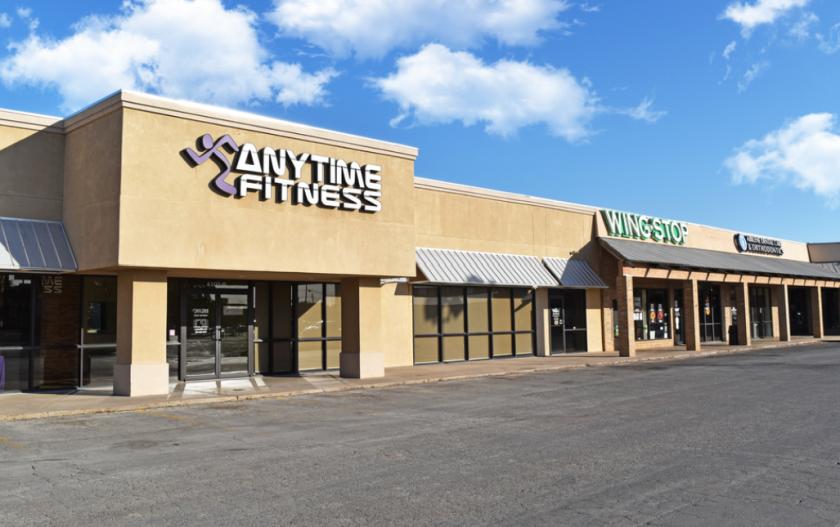
1-Mile | 3-Miles | 5-Miles | ||
---|---|---|---|---|
Total Population | 9,352 | 50,563 | 101,385 | |
Population Median Age | 37 | 37 | 36 | |
Population by Age | 0-9 Yrs | 1421 (15%) | 6941 (13%) | 14817 (14%) |
10-19 Yrs | 792 (8%) | 5853 (11%) | 13721 (13%) | |
20-29 Yrs | 2099 (22%) | 9546 (18%) | 19245 (18%) | |
30-39 Yrs | 1215 (12%) | 6836 (13%) | 13789 (13%) | |
40-49 Yrs | 723 (7%) | 4841 (9%) | 9498 (9%) | |
50-59 Yrs | 889 (9%) | 5969 (11%) | 10946 (10%) | |
60-69 Yrs | 1127 (12%) | 5122 (10%) | 9405 (9%) | |
70+ Yrs | 1084 (11%) | 5455 (10%) | 9963 (9%) | |
Median HH Income | $51,806 | $56,415 | $52,666 | |
Total Household Income | < 24K | 876 (22%) | 3702 (19%) | 7794 (20%) |
25-49K | 1022 (25%) | 4932 (25%) | 10150 (27%) | |
50-74K | 884 (22%) | 3951 (20%) | 7178 (19%) | |
75-99K | 361 (9%) | 2515 (12%) | 4623 (12%) | |
100-199K | 758 (19%) | 3642 (18%) | 6452 (17%) | |
200K+ | 61 (1%) | 717 (3%) | 1295 (3%) | |
Highest Education Level | No Diploma | 331 | 2842 | 6688 |
Diploma or GED | 1713 | 9749 | 19390 | |
Some College | 1526 | 7507 | 14995 | |
Assoc. Degree | 728 | 2979 | 5405 | |
Bachelors Degree | 1025 | 6038 | 10355 | |
Higher Degree | 565 | 3279 | 5477 | |
Total Housing Units | 4,290 | 22,244 | 42,924 | |
--Owner-Occupied | 1,771 | 10,799 | 20,763 | |
--Renter-Occupied | 2,191 | 8,662 | 16,730 | |
Owner-Occupied Values | < 100K | 369 | 3341 | 8011 |
100-199K | 1130 | 4730 | 8048 | |
200-299K | 233 | 1810 | 3003 | |
300-399K | 11 | 452 | 857 | |
400-499K | 9 | 262 | 413 | |
500K+ | 19 | 204 | 430 | |
Total Working Age Population | 7,363 | 40,202 | 78,506 | |
In Work Force | 4,900 | 26,812 | 51,688 | |
Not In Work Force | 2,463 | 13,390 | 26,818 | |
Workforce Employed | 4,306 | 24,472 | 46,884 | |
Workforce Unemployed | 194 | 842 | 1,674 | |
Civlian Workforce | 4,500 | 25,315 | 48,558 | |
Military Workforce | 400 | 1,497 | 3,130 | |
Total Households | 3,962 | 19,460 | 37,492 | |
Family Households | 2,167 | 12,019 | 24,211 | |
Non-Family Households | 1,795 | 7,442 | 13,282 | |
Married Couple | 1,584 | 9,235 | 17,160 | |
Other Family | 584 | 2,784 | 7,051 | |
Married w/Child | 486 | 3,173 | 6,781 | |
Single Male w/Child | 45 | 222 | 776 | |
Single Female w/Child | 341 | 1,321 | 3,243 |
Population Change Last Two Decades - Plus Projection
2000 | % | 2010 | % | 2020 | % | 2030 | |
---|---|---|---|---|---|---|---|
Texas | 20,851,820 | +21 | 25,145,561 | +18 | 29,677,668 | +18 | 34,894,452 |
Taylor County | 126,555 | +4 | 131,506 | +6 | 139,457 | +5 | 146,145 |
Total Working Age Population:
Total Households:
Total Working Age Population:
Total Households:
Total Working Age Population:
Total Households: