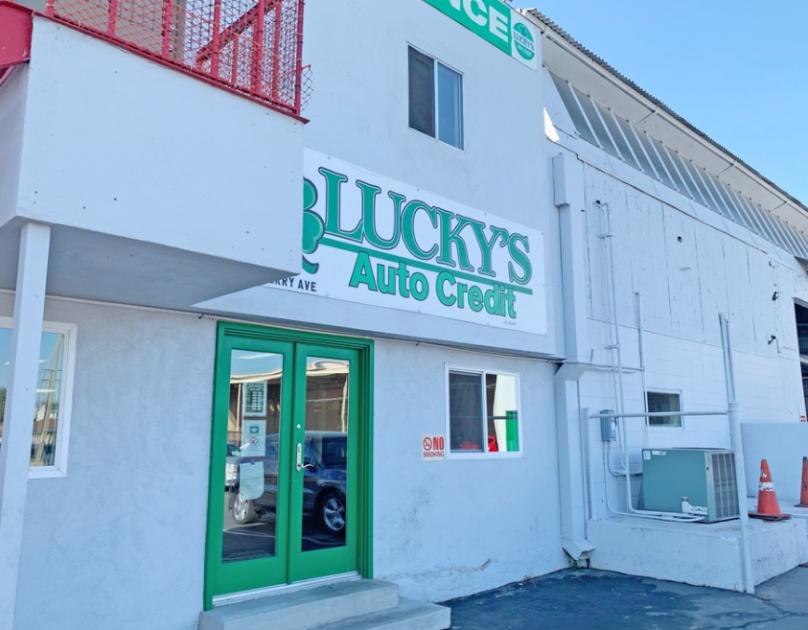
Retail Space
3431 Cherry Avenue Long Beach, CA 90807
3431 Cherry Avenue Long Beach, CA 90807
Details & Description
Property Highlights
- • 95 Leased
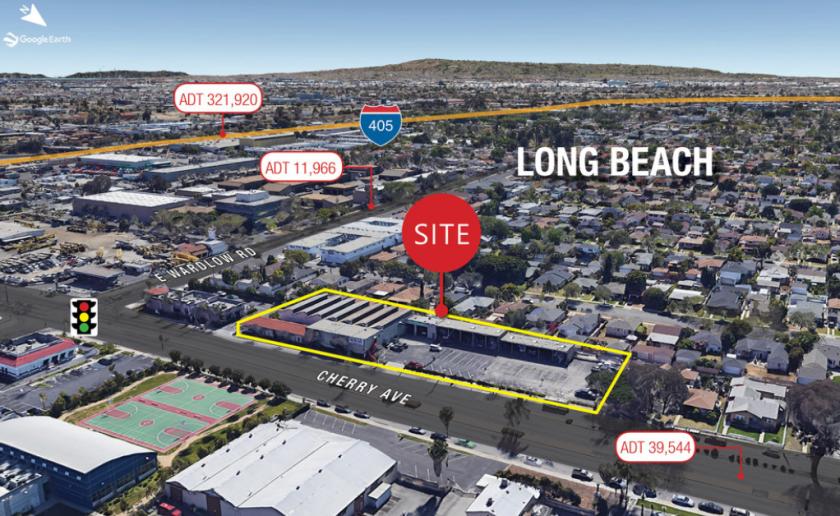
- • Dynamic retail trade area
- • Unusually large parcel
- • Strong demographics
- • Excellent 405 Freeway Access
Listing Agents

Jeff Linklater
O: 805-277-4025
M: 951-205-7595
jlinklater@naicapital.com
O: 805-277-4025
M: 951-205-7595
jlinklater@naicapital.com
While we strive to provide the most accurate information, all listing information, and demographic data, is provided by third-parties. As such, MyEListing will not be responsible for the accuracy of the information. It is strongly recommended that you verify all information with the listing agent, and any relevant agencies, prior to making any decisions.