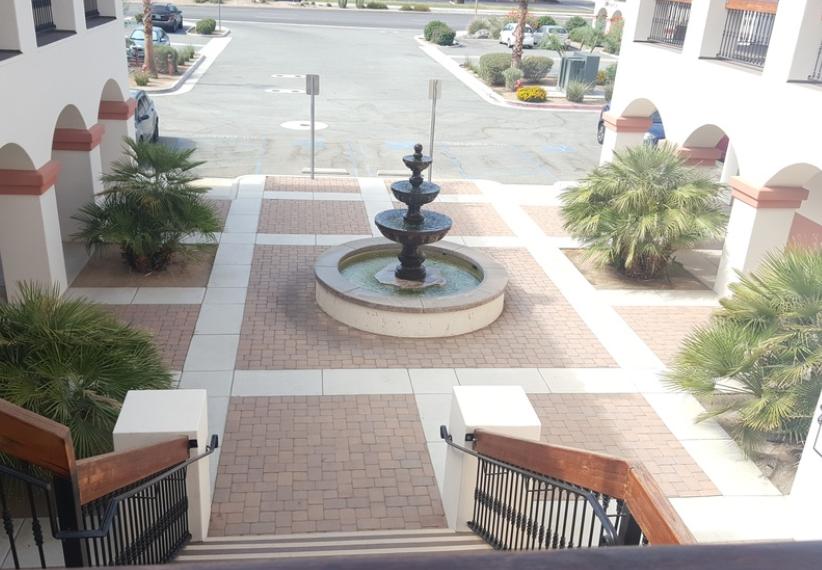
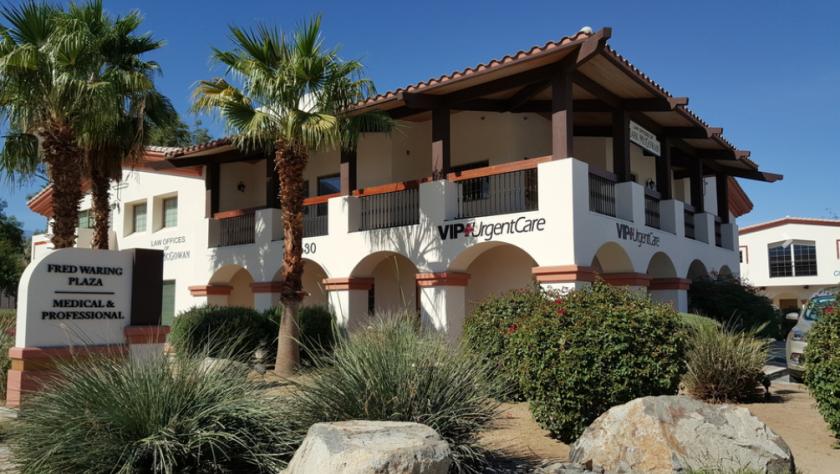
1-Mile | 3-Miles | 5-Miles | ||
---|---|---|---|---|
Total Population | 6,890 | 41,826 | 72,466 | |
Population Median Age | 45 | 52 | 53 | |
Population by Age | 0-9 Yrs | 549 (7%) | 2518 (6%) | 4322 (5%) |
10-19 Yrs | 638 (9%) | 3506 (8%) | 5163 (7%) | |
20-29 Yrs | 872 (12%) | 4174 (9%) | 6174 (8%) | |
30-39 Yrs | 841 (12%) | 3293 (7%) | 5541 (7%) | |
40-49 Yrs | 738 (10%) | 3699 (8%) | 6300 (8%) | |
50-59 Yrs | 894 (12%) | 5132 (12%) | 9077 (12%) | |
60-69 Yrs | 1096 (15%) | 7044 (16%) | 13170 (18%) | |
70+ Yrs | 1260 (18%) | 12459 (29%) | 22719 (31%) | |
Median HH Income | $50,285 | $60,668 | $64,721 | |
Total Household Income | < 24K | 814 (25%) | 4166 (21%) | 7193 (20%) |
25-49K | 751 (23%) | 4089 (20%) | 6871 (19%) | |
50-74K | 557 (17%) | 3207 (16%) | 5442 (15%) | |
75-99K | 387 (12%) | 2177 (11%) | 3680 (10%) | |
100-199K | 523 (16%) | 4051 (20%) | 7405 (21%) | |
200K+ | 112 (3%) | 1897 (9%) | 4124 (11%) | |
Highest Education Level | No Diploma | 678 | 2612 | 4239 |
Diploma or GED | 1277 | 6637 | 11297 | |
Some College | 1485 | 8833 | 16226 | |
Assoc. Degree | 418 | 2518 | 4458 | |
Bachelors Degree | 1022 | 7990 | 14220 | |
Higher Degree | 457 | 5038 | 9671 | |
Total Housing Units | 4,590 | 31,158 | 57,396 | |
--Owner-Occupied | 1,579 | 12,851 | 24,190 | |
--Renter-Occupied | 1,564 | 6,737 | 10,525 | |
Owner-Occupied Values | < 100K | 152 | 786 | 2055 |
100-199K | 110 | 1343 | 1858 | |
200-299K | 348 | 2531 | 4138 | |
300-399K | 442 | 2252 | 4189 | |
400-499K | 237 | 1943 | 3723 | |
500K+ | 290 | 3996 | 8225 | |
Total Working Age Population | 5,860 | 37,113 | 64,854 | |
In Work Force | 3,361 | 17,447 | 29,424 | |
Not In Work Force | 2,499 | 19,666 | 35,430 | |
Workforce Employed | 3,231 | 16,524 | 27,838 | |
Workforce Unemployed | 129 | 923 | 1,584 | |
Civlian Workforce | 3,361 | 17,447 | 29,422 | |
Military Workforce | 0 | 0 | 2 | |
Total Households | 3,143 | 19,587 | 34,715 | |
Family Households | 1,616 | 10,757 | 19,212 | |
Non-Family Households | 1,527 | 8,830 | 15,503 | |
Married Couple | 1,159 | 8,702 | 15,942 | |
Other Family | 457 | 2,055 | 3,269 | |
Married w/Child | 370 | 1,785 | 2,928 | |
Single Male w/Child | 67 | 304 | 434 | |
Single Female w/Child | 151 | 455 | 705 |
Population Change Last Two Decades - Plus Projection
2000 | % | 2010 | % | 2020 | % | 2030 | |
---|---|---|---|---|---|---|---|
California | 33,871,648 | +10 | 37,253,956 | +9 | 40,467,295 | +8 | 43,631,295 |
Riverside County | 1,545,387 | +42 | 2,189,641 | +14 | 2,493,116 | +14 | 2,843,493 |
Total Working Age Population:
Total Households:
Total Working Age Population:
Total Households:
Total Working Age Population:
Total Households: