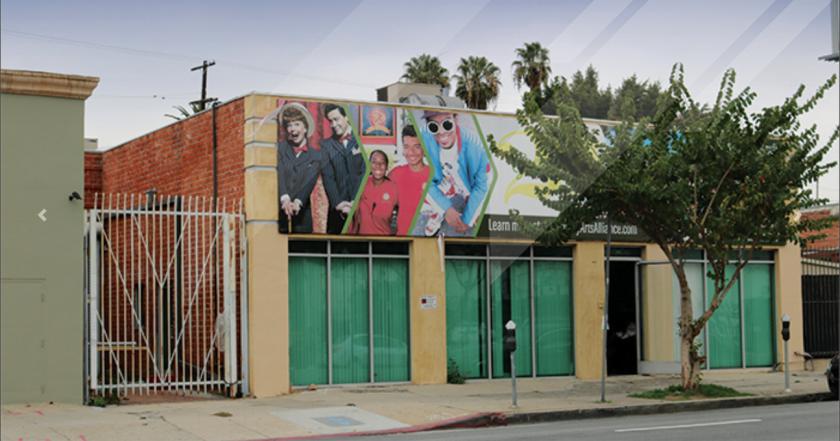
Office Space
6235 Santa Monica Boulevard Los Angeles, CA 90038
6235 Santa Monica Boulevard Los Angeles, CA 90038
Details & Description
Property Highlights
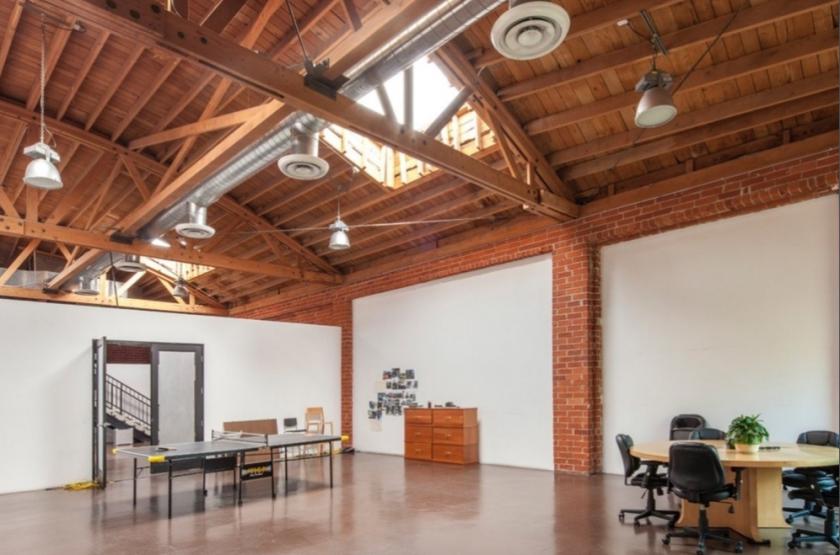
- • Great creative office conversion opportunity
- • Lots of natural light
- • Exposed brick and concrete flooring
- • 3 restrooms, 2 showers and 1 kitchen
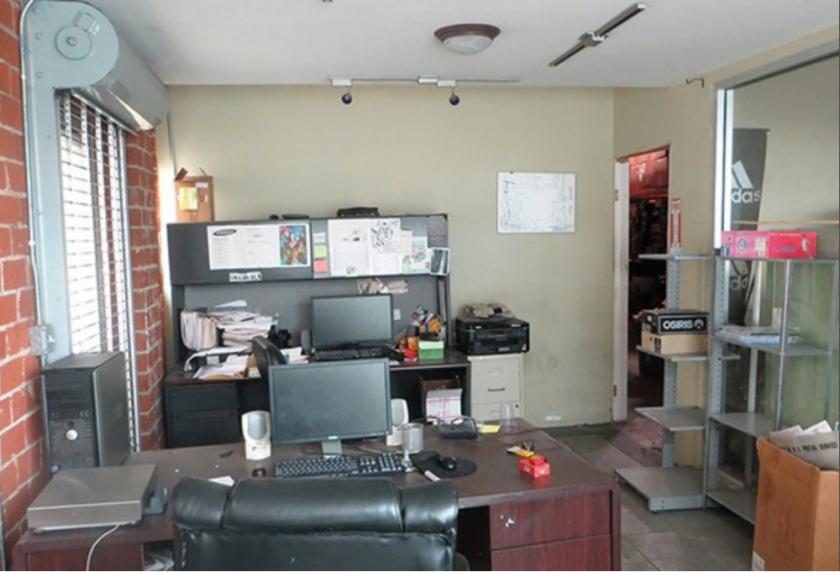
- • 5 private offices, conference room and showroom
- • 600 AMP 3 Phase, 4 Wire
Additional Photos

Listing Agents

Chris Jackson
O: 818-933-2368
M: 818-802-2627
cjackson@naicapital.com
O: 818-933-2368
M: 818-802-2627
cjackson@naicapital.com

Jared Swedelson
O: 818-742-1632
jswedelson@naicapital.com
O: 818-742-1632
jswedelson@naicapital.com
While we strive to provide the most accurate information, all listing information, and demographic data, is provided by third-parties. As such, MyEListing will not be responsible for the accuracy of the information. It is strongly recommended that you verify all information with the listing agent, and any relevant agencies, prior to making any decisions.


