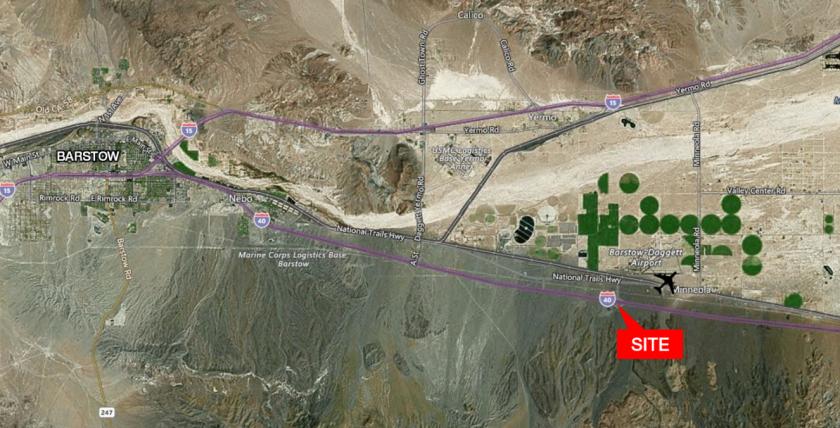
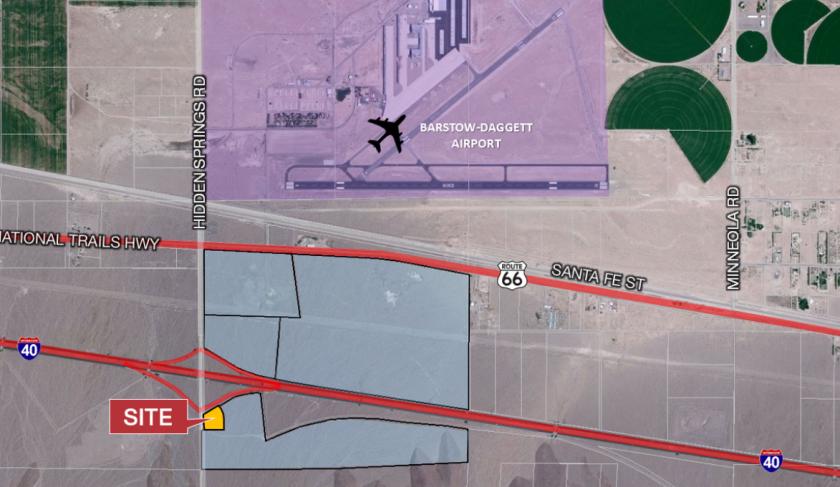
1-Mile | 3-Miles | 5-Miles | ||
---|---|---|---|---|
Total Population | 22 | 300 | 1,864 | |
Population Median Age | 41 | 38 | 36 | |
Population by Age | 0-9 Yrs | 4 (18%) | 55 (18%) | 326 (17%) |
10-19 Yrs | 1 (4%) | 36 (12%) | 224 (12%) | |
20-29 Yrs | 3 (13%) | 30 (10%) | 325 (17%) | |
30-39 Yrs | 2 (9%) | 33 (11%) | 222 (11%) | |
40-49 Yrs | 2 (9%) | 28 (9%) | 145 (7%) | |
50-59 Yrs | 3 (13%) | 39 (13%) | 221 (11%) | |
60-69 Yrs | 6 (27%) | 55 (18%) | 213 (11%) | |
70+ Yrs | 1 (4%) | 24 (8%) | 187 (10%) | |
Median HH Income | $25,992 | $48,455 | $54,710 | |
Total Household Income | < 24K | 3 (42%) | 31 (31%) | 133 (21%) |
25-49K | 1 (14%) | 21 (21%) | 154 (24%) | |
50-74K | 0 (0%) | 19 (19%) | 145 (23%) | |
75-99K | 1 (14%) | 13 (13%) | 83 (13%) | |
100-199K | 1 (14%) | 11 (11%) | 82 (13%) | |
200K+ | 0 (0%) | 5 (5%) | 26 (4%) | |
Highest Education Level | No Diploma | 5 | 53 | 205 |
Diploma or GED | 5 | 53 | 376 | |
Some College | 4 | 57 | 318 | |
Assoc. Degree | 0 | 14 | 142 | |
Bachelors Degree | 1 | 12 | 70 | |
Higher Degree | 1 | 12 | 64 | |
Total Housing Units | 10 | 138 | 785 | |
--Owner-Occupied | 4 | 63 | 354 | |
--Renter-Occupied | 3 | 37 | 269 | |
Owner-Occupied Values | < 100K | 1 | 22 | 130 |
100-199K | 3 | 35 | 196 | |
200-299K | 0 | 3 | 14 | |
300-399K | 0 | 2 | 5 | |
400-499K | 0 | 0 | 3 | |
500K+ | 0 | 2 | 6 | |
Total Working Age Population | 18 | 218 | 1,386 | |
In Work Force | 7 | 111 | 794 | |
Not In Work Force | 11 | 107 | 591 | |
Workforce Employed | 6 | 97 | 675 | |
Workforce Unemployed | 1 | 9 | 44 | |
Civlian Workforce | 7 | 106 | 719 | |
Military Workforce | 0 | 5 | 76 | |
Total Households | 7 | 100 | 623 | |
Family Households | 5 | 66 | 441 | |
Non-Family Households | 2 | 34 | 182 | |
Married Couple | 4 | 54 | 290 | |
Other Family | 1 | 12 | 151 | |
Married w/Child | 1 | 21 | 88 | |
Single Male w/Child | 0 | 0 | 19 | |
Single Female w/Child | 1 | 4 | 58 |
Population Change Last Two Decades - Plus Projection
2000 | % | 2010 | % | 2020 | % | 2030 | |
---|---|---|---|---|---|---|---|
California | 33,871,648 | +10 | 37,253,956 | +9 | 40,467,295 | +8 | 43,631,295 |
San Bernardino County | 1,709,434 | +19 | 2,035,210 | +9 | 2,223,189 | +11 | 2,468,202 |
Total Working Age Population:
Total Households:
Total Working Age Population:
Total Households:
Total Working Age Population:
Total Households: