Commercial Land
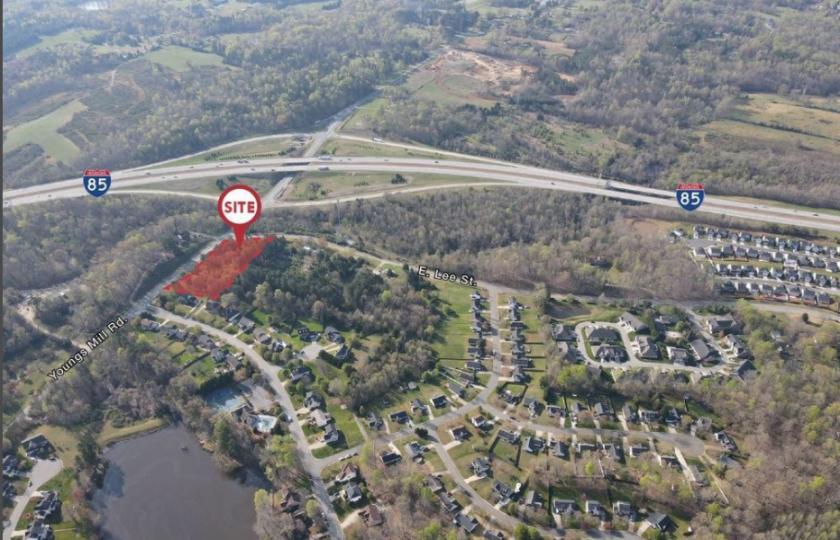
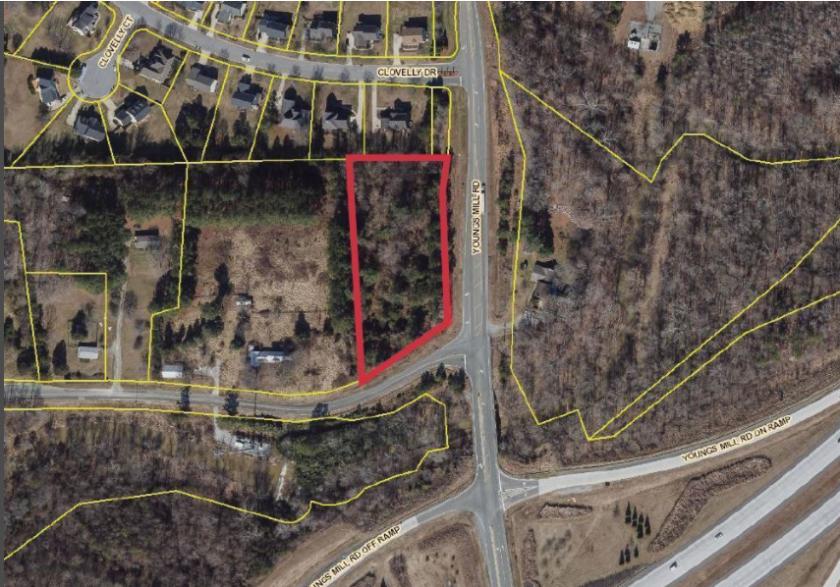
1730 Youngs Mill Road Greensboro, NC 27406
1730 Youngs Mill Road Greensboro, NC 27406
Details & Description
Property Highlights
- • Zoned CD-C-M Commercial
- • City Water and Sewer service available
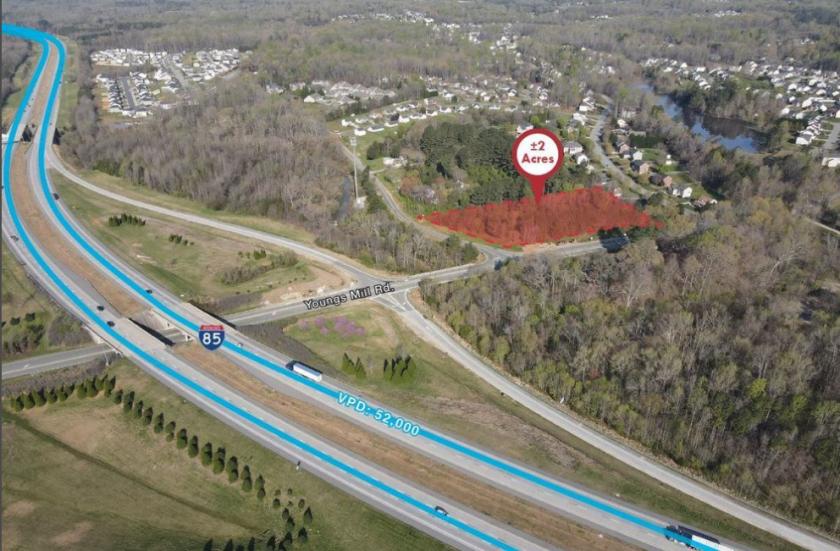
- • Traffic Count 2019 52,000 VPD I-85
Listing Agents

Elliot Sheridan
O: 704-752-8350
elliot@chambers-group.com
O: 704-752-8350
elliot@chambers-group.com

Sam Munday
O: 336-358-3225
M: 336-414-6141
smunday@naipt.com
O: 336-358-3225
M: 336-414-6141
smunday@naipt.com
While we strive to provide the most accurate information, all listing information, and demographic data, is provided by third-parties. As such, MyEListing will not be responsible for the accuracy of the information. It is strongly recommended that you verify all information with the listing agent, and any relevant agencies, prior to making any decisions.