Office Space
600 Congress Avenue Austin, TX 78701
600 Congress Avenue Austin, TX 78701

Details & Description
Property Highlights
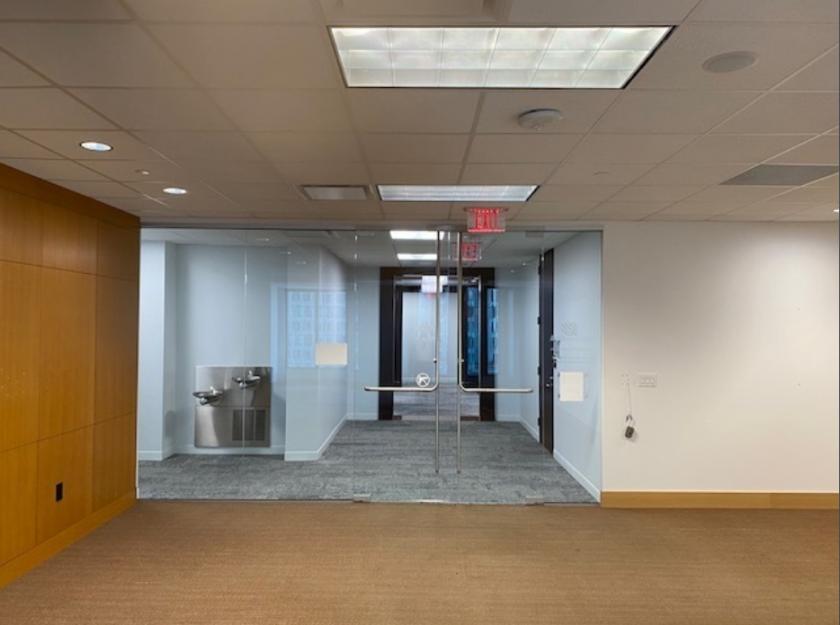
- • Break Room Reception Glass entry off elevator
- • Availability Immediately
- • Term 03312023
- • 24 hr on-site security On-site management
- • First-class fitness facility Yoga studio
- • Exclusive Patio
Additional Photos
Listing Agents

Ryan Bohls
O: 512-580-6061
ryan.bohls@naipartners.com
O: 512-580-6061
ryan.bohls@naipartners.com
While we strive to provide the most accurate information, all listing information, and demographic data, is provided by third-parties. As such, MyEListing will not be responsible for the accuracy of the information. It is strongly recommended that you verify all information with the listing agent, and any relevant agencies, prior to making any decisions.


