Commercial Land
12055 Chef Menteur Highway New Orleans, LA 70129
12055 Chef Menteur Highway New Orleans, LA 70129
Details & Description
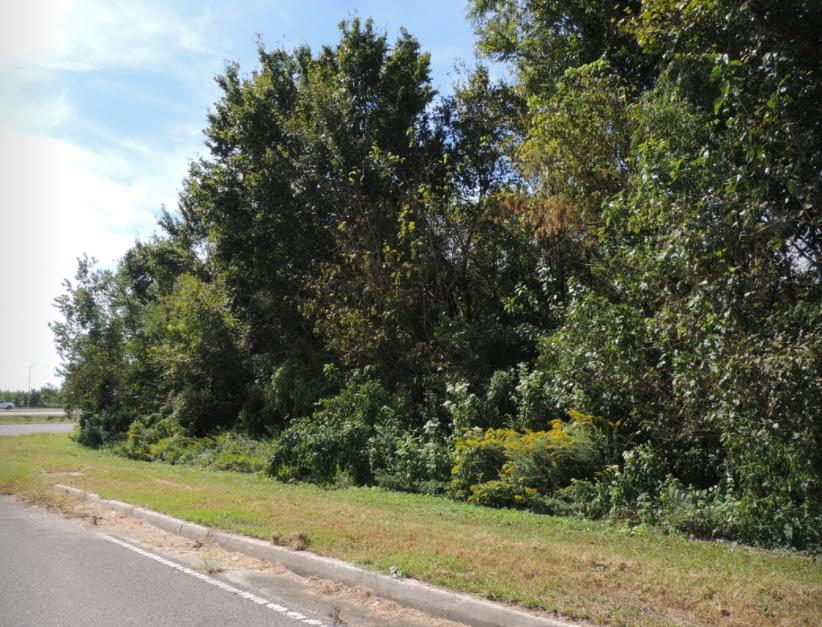
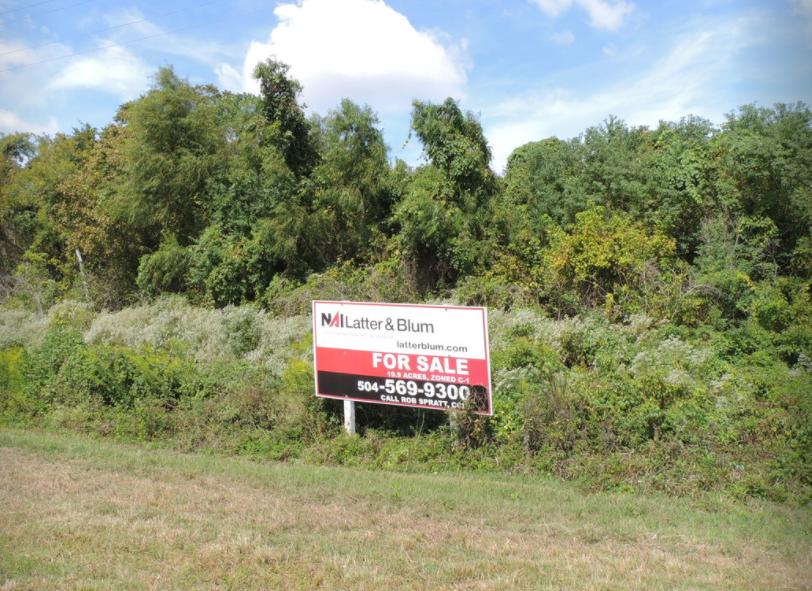
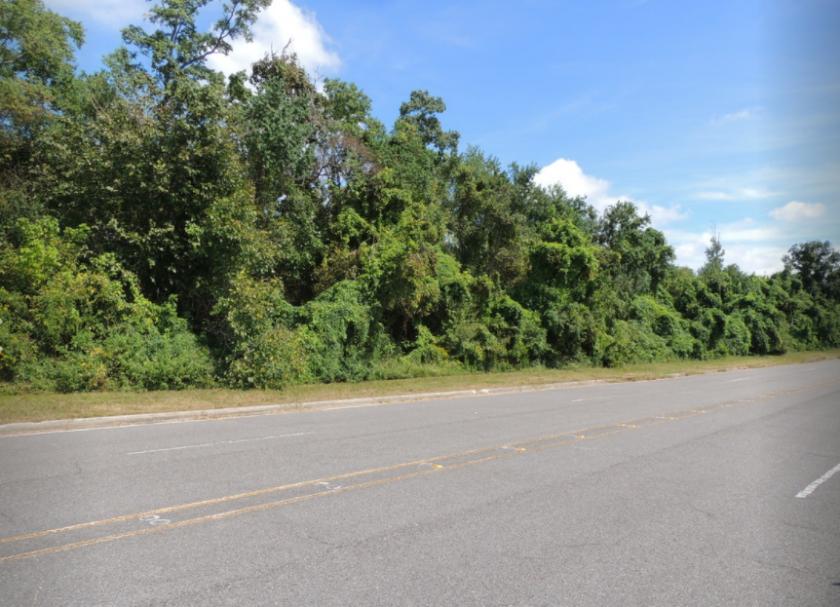
Additional Photos

Listing Agents

Cathy McGehee
O: 504-525-1311
M: 504-569-9489
csmcgehee@latterblum.com
O: 504-525-1311
M: 504-569-9489
csmcgehee@latterblum.com

Michael Naquin
O: 504-525-1311
M: 504-444-3972
mnaquin@latterblum.com
O: 504-525-1311
M: 504-444-3972
mnaquin@latterblum.com
While we strive to provide the most accurate information, all listing information, and demographic data, is provided by third-parties. As such, MyEListing will not be responsible for the accuracy of the information. It is strongly recommended that you verify all information with the listing agent, and any relevant agencies, prior to making any decisions.


