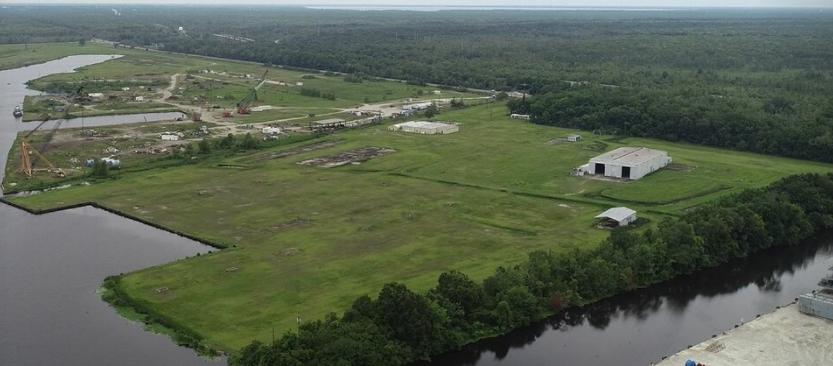
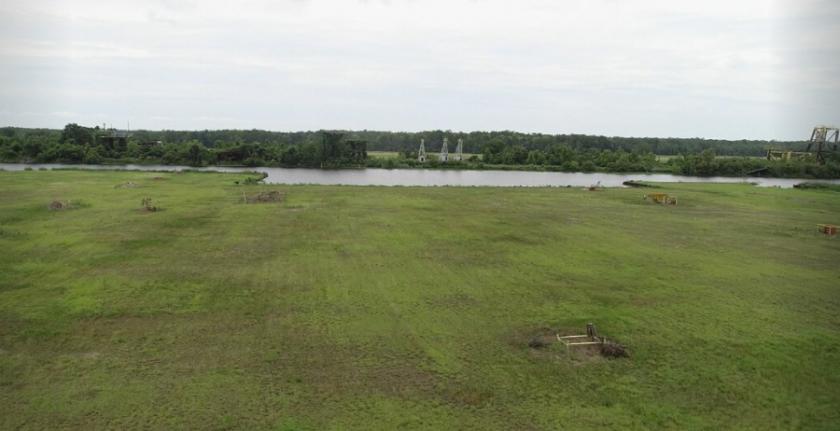
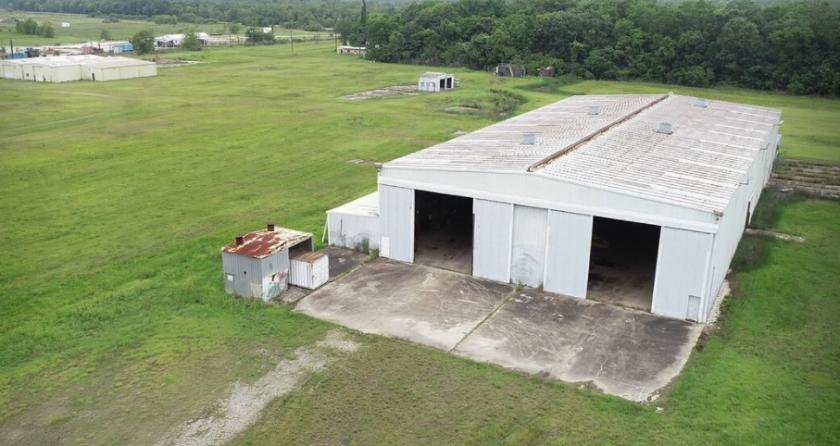
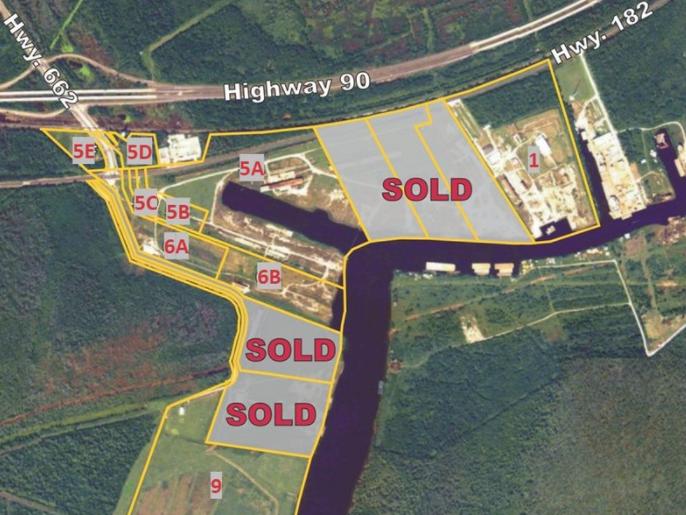
1-Mile | 3-Miles | 5-Miles | ||
---|---|---|---|---|
Total Population | 76 | 959 | 3,072 | |
Population Median Age | 44 | 40 | 39 | |
Population by Age | 0-9 Yrs | 8 (10%) | 112 (11%) | 371 (12%) |
10-19 Yrs | 6 (7%) | 115 (11%) | 399 (12%) | |
20-29 Yrs | 8 (10%) | 99 (10%) | 356 (11%) | |
30-39 Yrs | 8 (10%) | 137 (14%) | 482 (15%) | |
40-49 Yrs | 11 (14%) | 132 (13%) | 411 (13%) | |
50-59 Yrs | 16 (21%) | 145 (15%) | 382 (12%) | |
60-69 Yrs | 11 (14%) | 126 (13%) | 389 (12%) | |
70+ Yrs | 9 (11%) | 94 (9%) | 281 (9%) | |
Median HH Income | $26,433 | $25,475 | $27,756 | |
Total Household Income | < 24K | 15 (44%) | 182 (48%) | 512 (44%) |
25-49K | 8 (23%) | 81 (21%) | 274 (23%) | |
50-74K | 3 (8%) | 37 (9%) | 142 (12%) | |
75-99K | 3 (8%) | 27 (7%) | 98 (8%) | |
100-199K | 5 (14%) | 43 (11%) | 121 (10%) | |
200K+ | 0 (0%) | 3 (0%) | 11 (0%) | |
Highest Education Level | No Diploma | 13 | 154 | 477 |
Diploma or GED | 29 | 354 | 1081 | |
Some College | 8 | 117 | 378 | |
Assoc. Degree | 3 | 21 | 75 | |
Bachelors Degree | 3 | 28 | 115 | |
Higher Degree | 0 | 2 | 20 | |
Total Housing Units | 39 | 446 | 1,370 | |
--Owner-Occupied | 19 | 249 | 809 | |
--Renter-Occupied | 15 | 124 | 350 | |
Owner-Occupied Values | < 100K | 9 | 131 | 430 |
100-199K | 6 | 74 | 247 | |
200-299K | 3 | 28 | 79 | |
300-399K | 0 | 9 | 38 | |
400-499K | 0 | 3 | 7 | |
500K+ | 1 | 3 | 9 | |
Total Working Age Population | 65 | 757 | 2,394 | |
In Work Force | 29 | 364 | 1,232 | |
Not In Work Force | 36 | 394 | 1,162 | |
Workforce Employed | 27 | 333 | 1,129 | |
Workforce Unemployed | 1 | 26 | 89 | |
Civlian Workforce | 29 | 359 | 1,218 | |
Military Workforce | 0 | 4 | 13 | |
Total Households | 34 | 373 | 1,159 | |
Family Households | 21 | 243 | 749 | |
Non-Family Households | 13 | 130 | 410 | |
Married Couple | 12 | 142 | 452 | |
Other Family | 9 | 101 | 297 | |
Married w/Child | 0 | 19 | 106 | |
Single Male w/Child | 0 | 3 | 15 | |
Single Female w/Child | 6 | 65 | 165 |
Population Change Last Two Decades - Plus Projection
2000 | % | 2010 | % | 2020 | % | 2030 | |
---|---|---|---|---|---|---|---|
Louisiana | 4,468,976 | +1 | 4,533,372 | +1 | 4,588,310 | +5 | 4,813,420 |
Assumption Parish | 23,388 | 0 | 23,421 | -7 | 21,840 | -7 | 20,250 |
Lafourche Parish | 89,974 | +7 | 96,318 | 0 | 95,990 | 0 | 95,990 |
St. Martin Parish | 48,583 | +7 | 52,160 | +6 | 55,520 | +3 | 57,000 |
St. Mary Parish | 53,500 | +2 | 54,650 | -17 | 45,230 | -11 | 40,390 |
Terrebonne Parish | 104,503 | +7 | 111,860 | +11 | 124,410 | +1 | 125,210 |
Total Working Age Population:
Total Households:
Total Working Age Population:
Total Households:
Total Working Age Population:
Total Households: