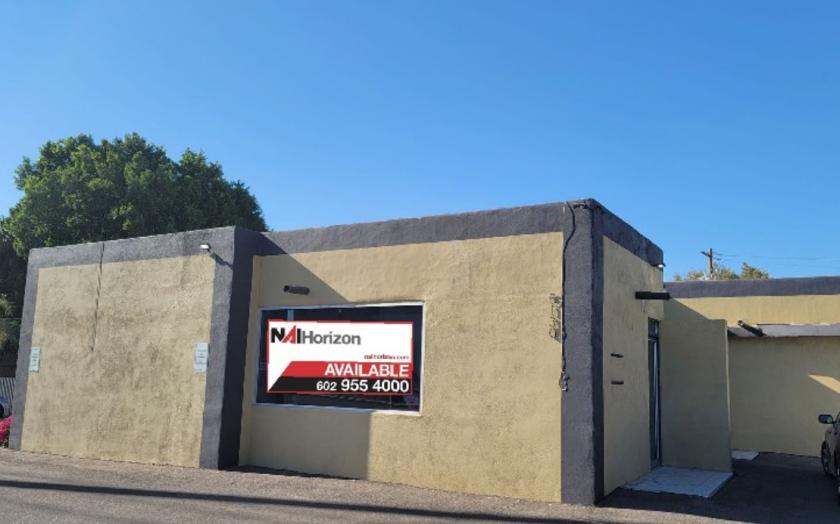
Office Space
5130 East Thomas Road Phoenix, AZ 85018
5130 East Thomas Road Phoenix, AZ 85018
Details & Description
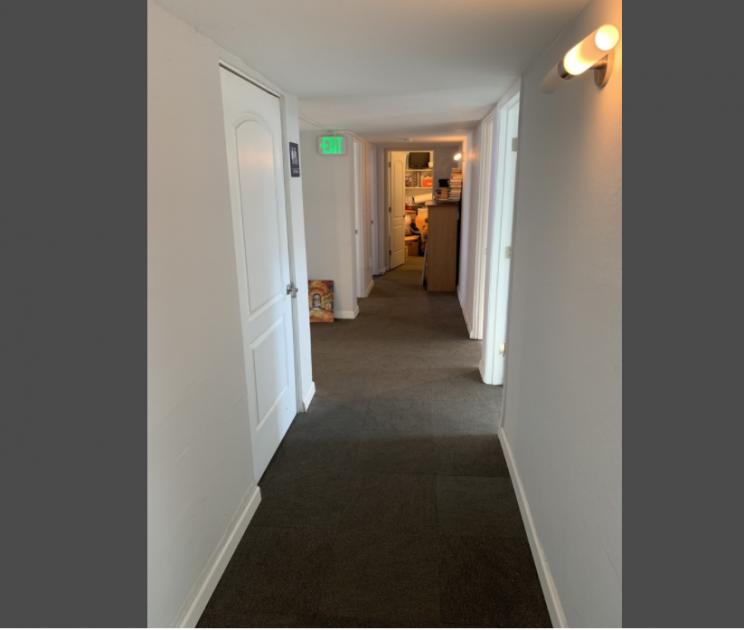
Additional Photos


Listing Agents

Tom Bean
O: 602-393-6790
M: 480-273-1590
thomas.bean@naihorizon.com
O: 602-393-6790
M: 480-273-1590
thomas.bean@naihorizon.com

Matt Harper
O: 602-393-6604
M: 623-692-9435
matt.harper@naihorizon.com
O: 602-393-6604
M: 623-692-9435
matt.harper@naihorizon.com
While we strive to provide the most accurate information, all listing information, and demographic data, is provided by third-parties. As such, MyEListing will not be responsible for the accuracy of the information. It is strongly recommended that you verify all information with the listing agent, and any relevant agencies, prior to making any decisions.


