Four individual parcels with one or more buildings on each
Parcels 111-44-068, 111-44-069, 111-44-076, 111-44-077
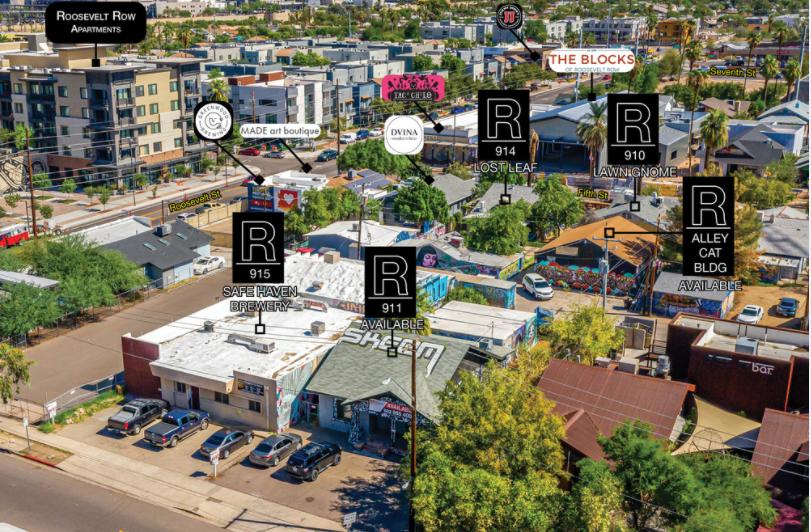
911 N 4th St - 1,375 SF Bldg Available
915 N 4th St - 5,000 SF Bldg Safe Haven Brewery
910 N 5th St - 1,600 SF Bldg Alley Cat Bldg-Available 1,440 SF Bldg Lawn Gnome
914 N 5th St - 1,440 SF Bldg Lost Leaf
0.66 Acres or 28,636 SF
Zoning DTC-E-EV, City of Phoenix
Multi property individual commercial buildings or converted historic homes in Evans-Churchill Historic District
One structure available for lease
Suitable for restaurants, wine bar, art galleries, retail shops, music shops needs improvements
Can be re-purposed for unusual, creative food or artistic endeavors
Opportunity to Lease or Own Commercial Space in Highly Desirable Roosevelt Row Arts District
No part of this information may be copied, reproduced, repurposed, or screen-captured for any commercial purpose without prior written authorization from MyEListing.
While we strive to provide the most accurate information, all listing information, and demographic data, is provided by third-parties. As such, MyEListing will not be responsible for the accuracy of the information. It is strongly recommended that you verify all information with the listing agent, and any relevant agencies, prior to making any decisions.
What is the building size of this commercial Retail property?
The size of this multi-unit property varies between 1375 - 1600 square feet
What kind of Retail is the propery at 911 North 4th Street?
The property at 911 North 4th Street Phoenix, AZ 85004 is listed as a Free Standing Building Retail property
What is the population within 1 mile of 911 North 4th Street in Phoenix?
The population within 1 mile of 911 North 4th Street Phoenix, AZ 85004 is 17,387 people.
Who do I contact for questions about 911 North 4th Street?
You should contact the listing agent,
Matt Harper, for any details regarding this commercial listing.