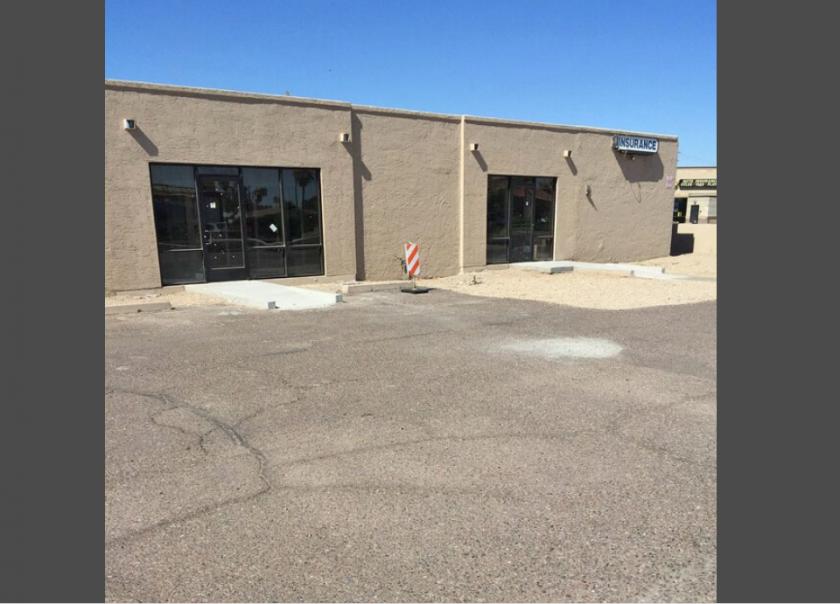
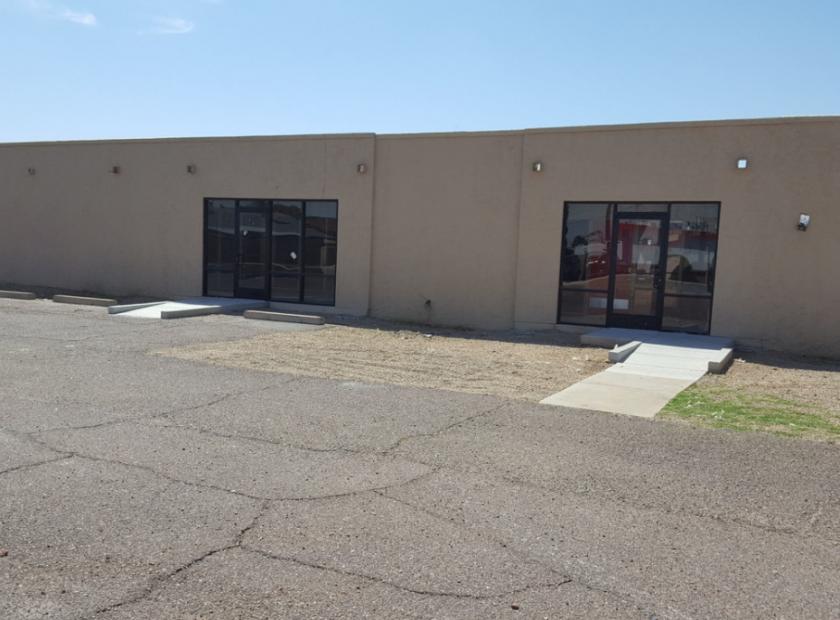
Retail Space
4243 West Bethany Home Road Phoenix, AZ 85019
4243 West Bethany Home Road Phoenix, AZ 85019
Details & Description
Property Highlights
- • Located on a 0.28 acre lot
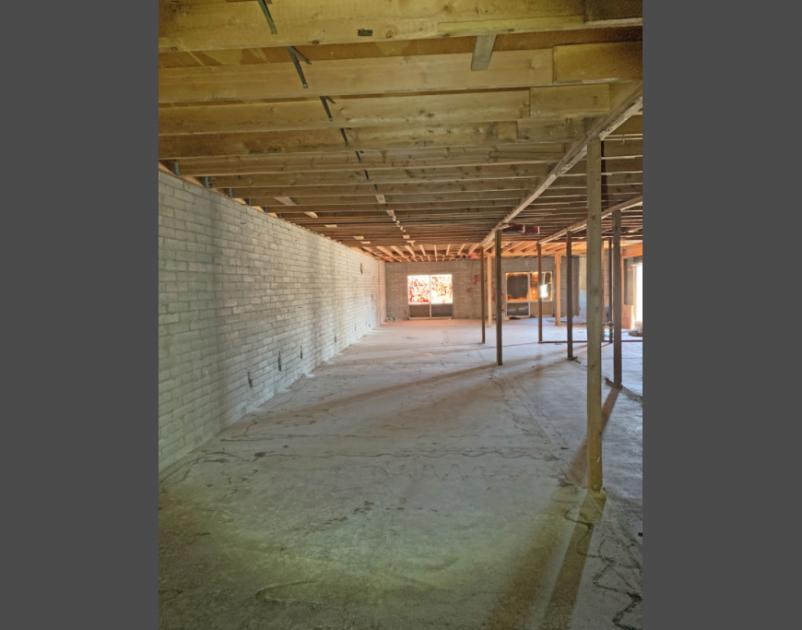
- • Shell condition
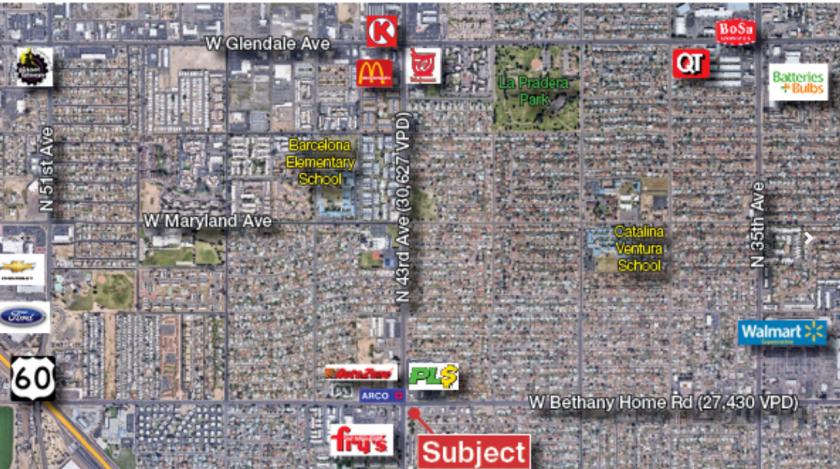
- • Strong traffic counts
- • Adjacent to ARCO gas station and Country Boys
- • Adjacent to hard corner
- • Densely populated trade area
Additional Photos
Listing Agents

Matt Harper
O: 602-393-6604
M: 623-692-9435
matt.harper@naihorizon.com
O: 602-393-6604
M: 623-692-9435
matt.harper@naihorizon.com
While we strive to provide the most accurate information, all listing information, and demographic data, is provided by third-parties. As such, MyEListing will not be responsible for the accuracy of the information. It is strongly recommended that you verify all information with the listing agent, and any relevant agencies, prior to making any decisions.


