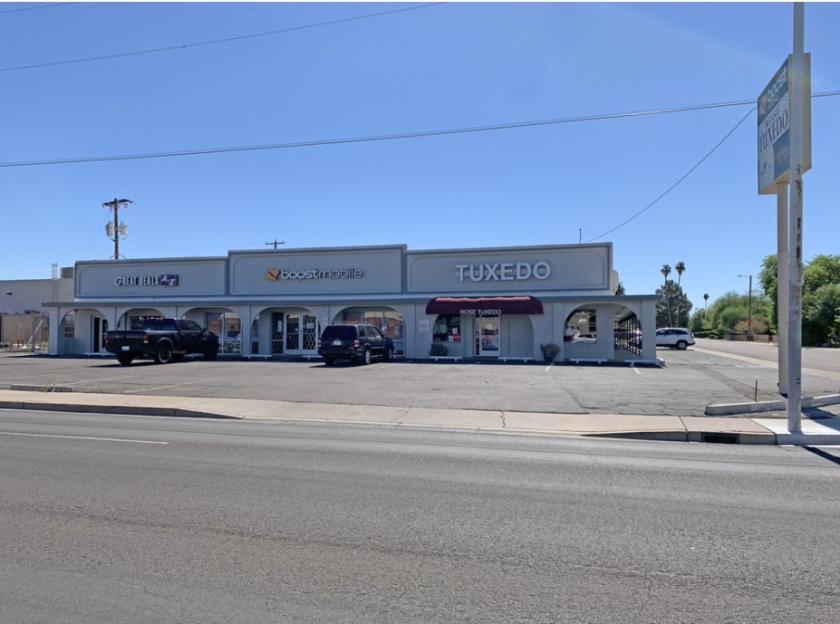
Retail Space
4031 North 24th Street Phoenix, AZ 85016
4031 North 24th Street Phoenix, AZ 85016
Details & Description
Property Highlights
- • Frontage on 24th St
- • Monument signage
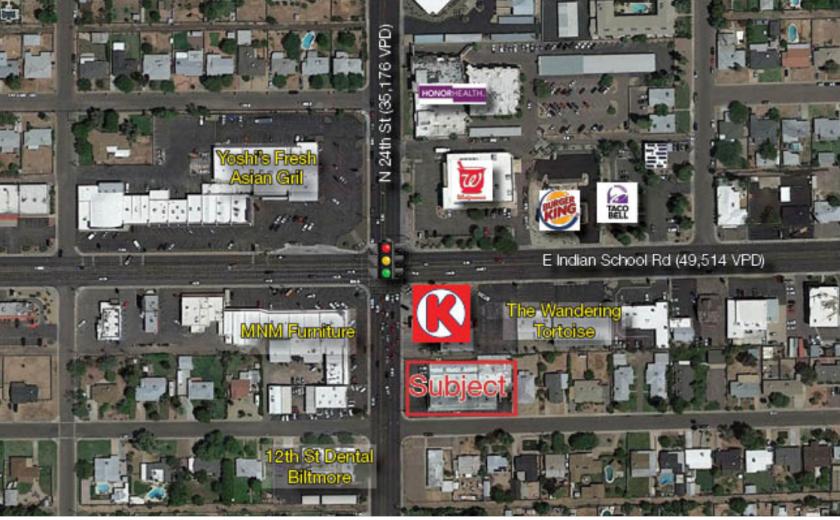
- • Strong traffic counts
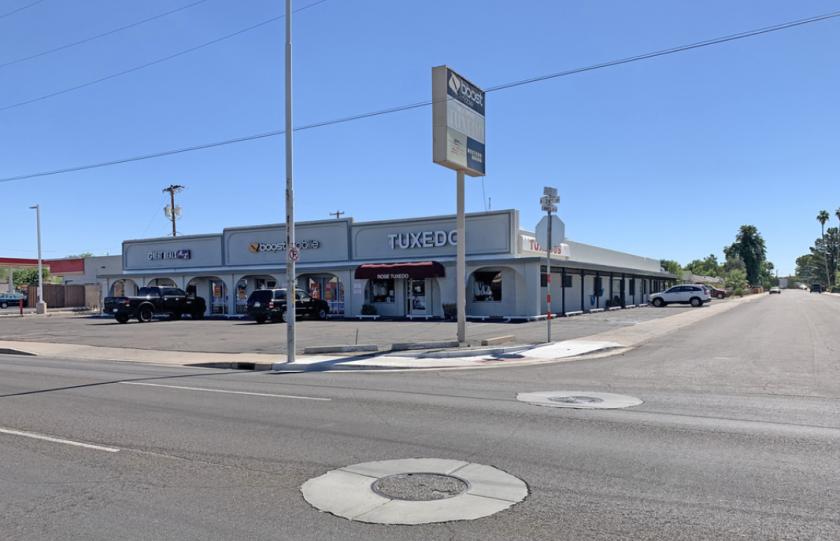
- • Fenced yard
- • Easy IngressEgress
- • Adjacent to Circle K
Additional Photos

Listing Agents

Matt Harper
O: 602-393-6604
M: 623-692-9435
matt.harper@naihorizon.com
O: 602-393-6604
M: 623-692-9435
matt.harper@naihorizon.com
While we strive to provide the most accurate information, all listing information, and demographic data, is provided by third-parties. As such, MyEListing will not be responsible for the accuracy of the information. It is strongly recommended that you verify all information with the listing agent, and any relevant agencies, prior to making any decisions.


