Industrial Properties
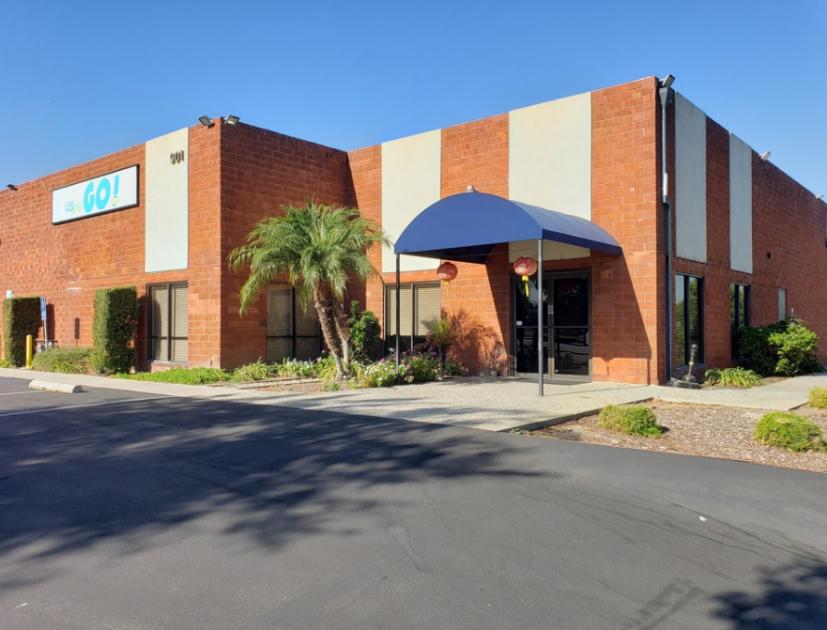
16030 Phoenix Drive City Of Industry, CA 91745
16030 Phoenix Drive City Of Industry, CA 91745
Details & Description
Property Highlights
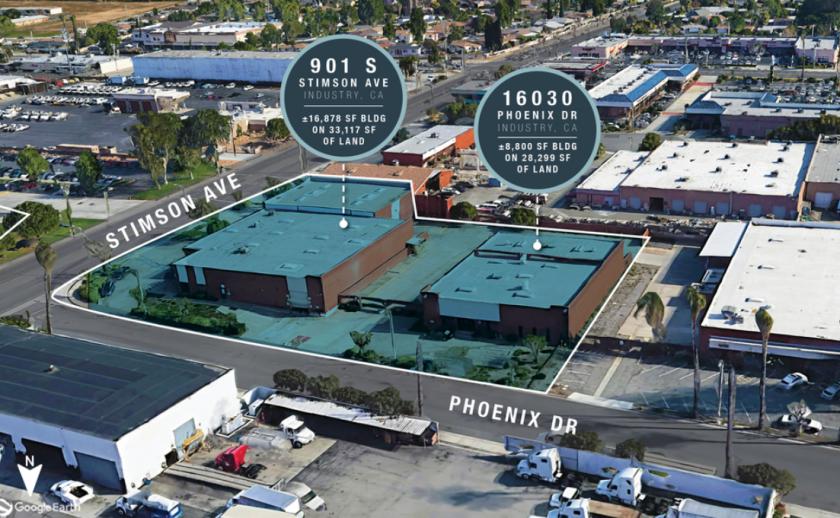
- • Two Freestanding Buildings
- • Large Fenced Yard
- • 61,416 SF Combined Lot
- • 3,340 SF of Office Space
- • 1 Dock High
- • 4 Ground Level
Listing Agents

Ryan Campbell
M: 323-377-6534
rcampbell@naicapital.com
M: 323-377-6534
rcampbell@naicapital.com
While we strive to provide the most accurate information, all listing information, and demographic data, is provided by third-parties. As such, MyEListing will not be responsible for the accuracy of the information. It is strongly recommended that you verify all information with the listing agent, and any relevant agencies, prior to making any decisions.