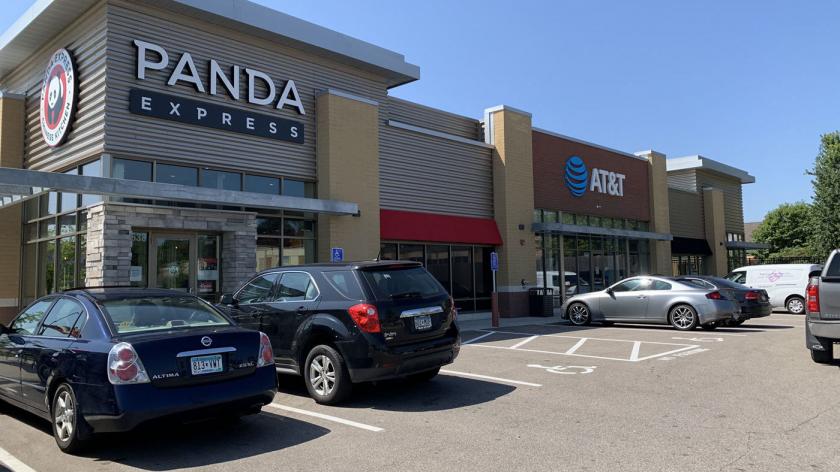
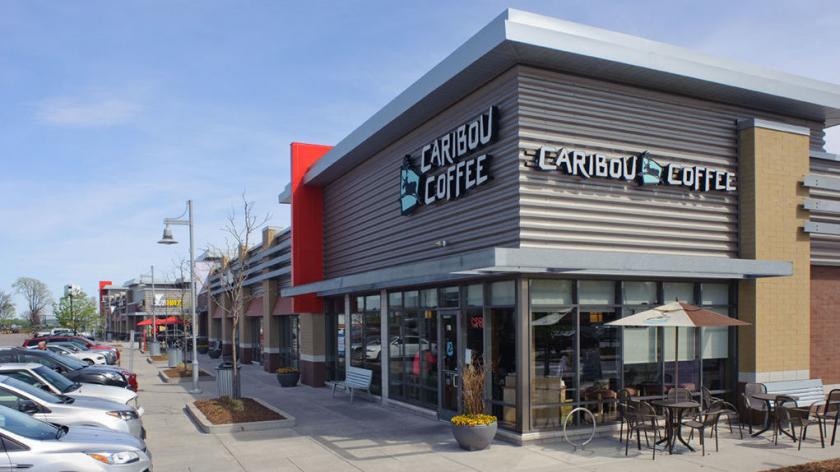
1-Mile | 3-Miles | 5-Miles | ||
---|---|---|---|---|
Total Population | 9,566 | 104,788 | 328,824 | |
Population Median Age | 36 | 38 | 38 | |
Population by Age | 0-9 Yrs | 1591 (16%) | 15011 (14%) | 42727 (12%) |
10-19 Yrs | 1068 (11%) | 11160 (10%) | 34701 (10%) | |
20-29 Yrs | 1155 (12%) | 12648 (12%) | 48323 (14%) | |
30-39 Yrs | 1847 (19%) | 18966 (18%) | 57147 (17%) | |
40-49 Yrs | 1211 (12%) | 14088 (13%) | 42600 (12%) | |
50-59 Yrs | 1032 (10%) | 12676 (12%) | 39316 (11%) | |
60-69 Yrs | 964 (10%) | 11385 (10%) | 33617 (10%) | |
70+ Yrs | 697 (7%) | 8854 (8%) | 30393 (9%) | |
Median HH Income | $81,336 | $81,278 | $74,894 | |
Total Household Income | < 24K | 364 (10%) | 5335 (12%) | 19866 (14%) |
25-49K | 542 (16%) | 7092 (16%) | 25318 (18%) | |
50-74K | 633 (18%) | 7053 (16%) | 23396 (17%) | |
75-99K | 542 (16%) | 5980 (14%) | 18568 (13%) | |
100-199K | 1072 (31%) | 12421 (29%) | 35760 (26%) | |
200K+ | 199 (5%) | 4082 (9%) | 14067 (10%) | |
Highest Education Level | No Diploma | 771 | 5859 | 19390 |
Diploma or GED | 1297 | 12042 | 35203 | |
Some College | 1202 | 13063 | 38904 | |
Assoc. Degree | 647 | 6290 | 18285 | |
Bachelors Degree | 1892 | 22913 | 73590 | |
Higher Degree | 787 | 14015 | 47746 | |
Total Housing Units | 3,478 | 43,698 | 143,538 | |
--Owner-Occupied | 2,604 | 29,765 | 84,238 | |
--Renter-Occupied | 747 | 12,198 | 52,737 | |
Owner-Occupied Values | < 100K | 22 | 1112 | 3787 |
100-199K | 781 | 6476 | 17566 | |
200-299K | 1506 | 12702 | 30080 | |
300-399K | 224 | 5210 | 14791 | |
400-499K | 50 | 2215 | 7458 | |
500K+ | 21 | 2050 | 10557 | |
Total Working Age Population | 7,258 | 82,259 | 263,724 | |
In Work Force | 5,340 | 61,271 | 194,873 | |
Not In Work Force | 1,918 | 20,988 | 68,851 | |
Workforce Employed | 5,224 | 59,065 | 187,291 | |
Workforce Unemployed | 113 | 2,192 | 7,509 | |
Civlian Workforce | 5,338 | 61,258 | 194,800 | |
Military Workforce | 3 | 14 | 73 | |
Total Households | 3,351 | 41,963 | 136,975 | |
Family Households | 2,189 | 25,378 | 75,536 | |
Non-Family Households | 1,163 | 16,585 | 61,439 | |
Married Couple | 1,687 | 19,659 | 57,810 | |
Other Family | 502 | 5,719 | 17,726 | |
Married w/Child | 837 | 8,789 | 25,407 | |
Single Male w/Child | 70 | 808 | 2,415 | |
Single Female w/Child | 180 | 2,274 | 7,209 |
Population Change Last Two Decades - Plus Projection
2000 | % | 2010 | % | 2020 | % | 2030 | |
---|---|---|---|---|---|---|---|
Minnesota | 4,919,479 | +8 | 5,303,925 | +7 | 5,687,161 | +5 | 5,974,304 |
Dakota County | 355,904 | +12 | 398,552 | +9 | 434,203 | +7 | 463,564 |
Hennepin County | 1,116,200 | +3 | 1,152,425 | +12 | 1,294,371 | +9 | 1,407,332 |
Ramsey County | 511,035 | 0 | 508,640 | +12 | 567,959 | +9 | 616,408 |
Total Working Age Population:
Total Households:
Total Working Age Population:
Total Households:
Total Working Age Population:
Total Households: