Industrial Properties
9590 Lynn Buff Court Laurel, MD 20723
9590 Lynn Buff Court Laurel, MD 20723

Details & Description
Property Highlights
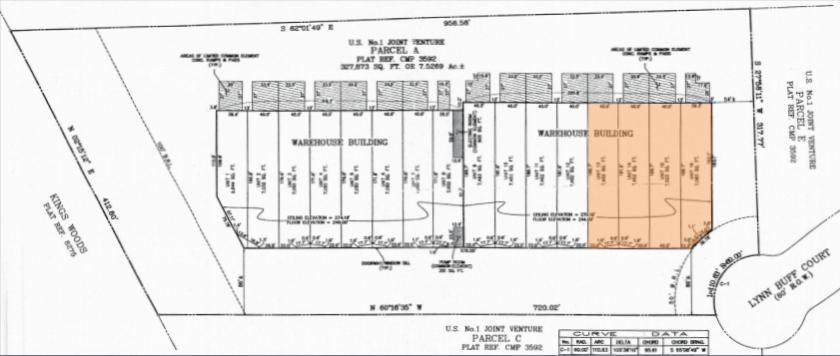
- • Units 13-14 20 office
- • Units 15-16 45 office
- • Ceilings 24 clear
- • Parking Customer employee parking in front rear
- • Sprinkler Wet system
- • Current Real Estate Tax $13,705 per unit annually
Listing Agents

Charles Breitenother
O: 443-574-1422
M: 443-864-6348
cbreitenother@klnb.com
O: 443-574-1422
M: 443-864-6348
cbreitenother@klnb.com
While we strive to provide the most accurate information, all listing information, and demographic data, is provided by third-parties. As such, MyEListing will not be responsible for the accuracy of the information. It is strongly recommended that you verify all information with the listing agent, and any relevant agencies, prior to making any decisions.