Specialty Real Estate
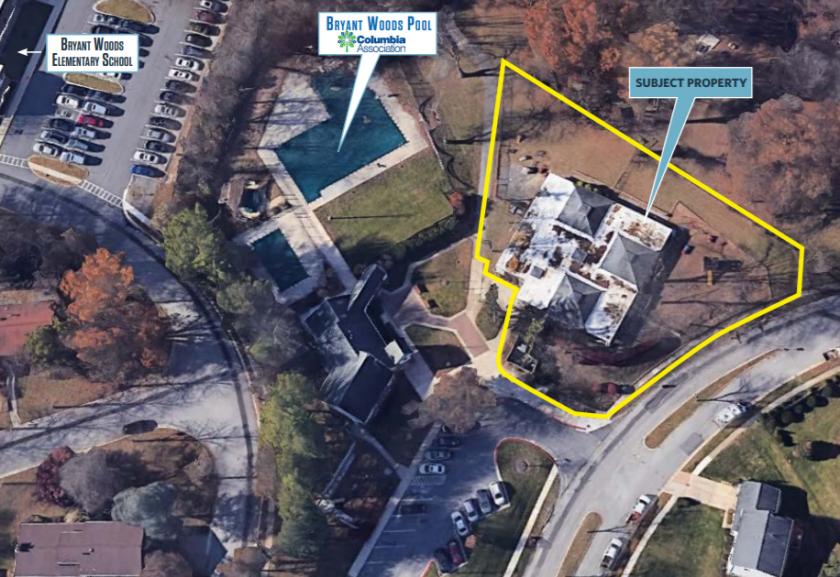
10453 Green Mountain Circle Columbia, MD 21044
10453 Green Mountain Circle Columbia, MD 21044
Details & Description
Property Highlights
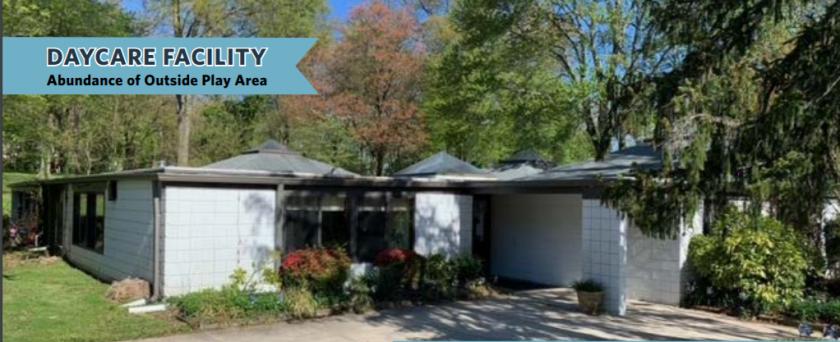
- • Current Capacity 76 children
- • Heart of Columbia, Maryland
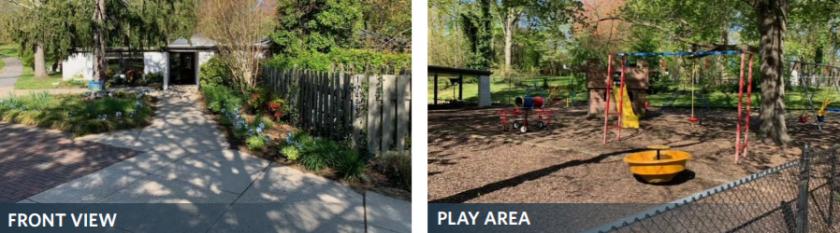
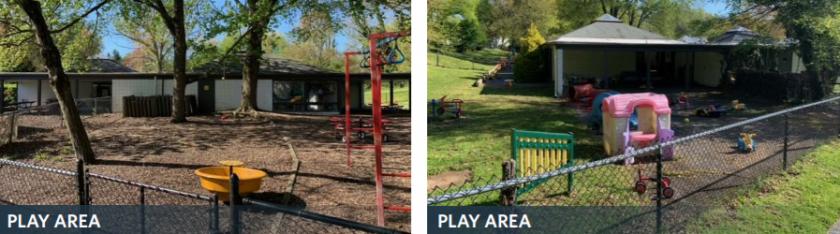
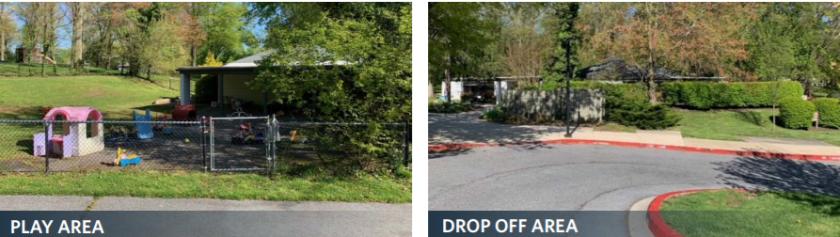
- • Fully built out as an existing Daycare
- • Building Size 5,704 square feet
Additional Photos
Listing Agents

Austin Eber
O: 443-791-8280
M: 443-791-8280
aeber@klnb.com
O: 443-791-8280
M: 443-791-8280
aeber@klnb.com

Charles Breitenother
O: 443-574-1422
M: 443-864-6348
cbreitenother@klnb.com
O: 443-574-1422
M: 443-864-6348
cbreitenother@klnb.com
While we strive to provide the most accurate information, all listing information, and demographic data, is provided by third-parties. As such, MyEListing will not be responsible for the accuracy of the information. It is strongly recommended that you verify all information with the listing agent, and any relevant agencies, prior to making any decisions.


