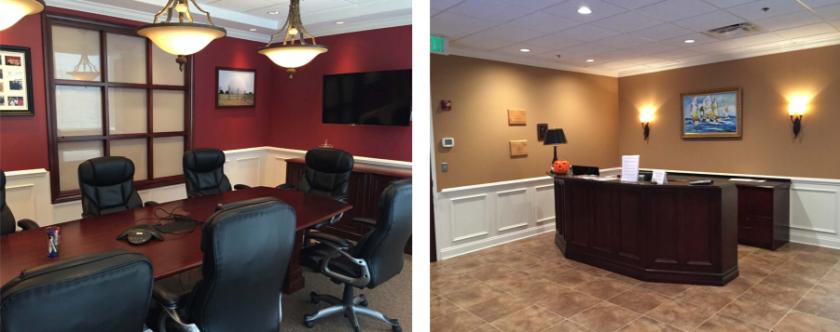
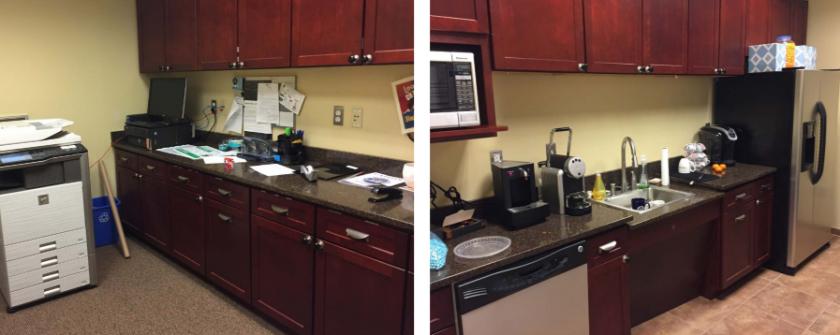
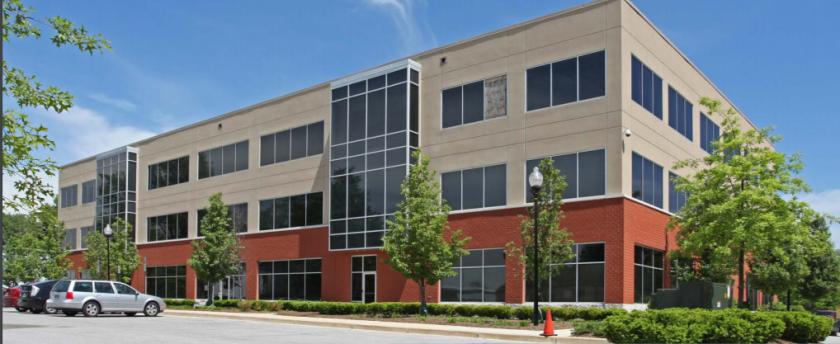
1-Mile | 3-Miles | 5-Miles | ||
---|---|---|---|---|
Total Population | 9,101 | 73,699 | 209,803 | |
Population Median Age | 39 | 38 | 37 | |
Population by Age | 0-9 Yrs | 975 (10%) | 9042 (12%) | 26777 (12%) |
10-19 Yrs | 1108 (12%) | 9271 (12%) | 26184 (12%) | |
20-29 Yrs | 1275 (14%) | 9903 (13%) | 28459 (13%) | |
30-39 Yrs | 1444 (15%) | 10914 (14%) | 32668 (15%) | |
40-49 Yrs | 1209 (13%) | 10457 (14%) | 30222 (14%) | |
50-59 Yrs | 1122 (12%) | 9356 (12%) | 28414 (13%) | |
60-69 Yrs | 1097 (12%) | 7845 (10%) | 20581 (9%) | |
70+ Yrs | 870 (9%) | 6912 (9%) | 16497 (7%) | |
Median HH Income | $112,569 | $110,593 | $111,845 | |
Total Household Income | < 24K | 257 (7%) | 2653 (9%) | 6427 (8%) |
25-49K | 213 (6%) | 2295 (8%) | 6714 (8%) | |
50-74K | 392 (11%) | 3492 (12%) | 9155 (12%) | |
75-99K | 580 (16%) | 3852 (13%) | 10778 (14%) | |
100-199K | 1562 (44%) | 10817 (38%) | 28505 (37%) | |
200K+ | 497 (14%) | 4782 (17%) | 13761 (18%) | |
Highest Education Level | No Diploma | 260 | 2743 | 8784 |
Diploma or GED | 859 | 7192 | 22019 | |
Some College | 978 | 7885 | 22604 | |
Assoc. Degree | 405 | 2940 | 8342 | |
Bachelors Degree | 2021 | 15094 | 41961 | |
Higher Degree | 1823 | 14835 | 40247 | |
Total Housing Units | 3,664 | 29,371 | 79,216 | |
--Owner-Occupied | 2,551 | 19,597 | 51,344 | |
--Renter-Occupied | 949 | 8,294 | 23,996 | |
Owner-Occupied Values | < 100K | 39 | 443 | 1667 |
100-199K | 67 | 1096 | 2809 | |
200-299K | 709 | 4211 | 9305 | |
300-399K | 1137 | 6116 | 15375 | |
400-499K | 455 | 4409 | 9705 | |
500K+ | 144 | 3323 | 12482 | |
Total Working Age Population | 7,428 | 59,138 | 166,676 | |
In Work Force | 5,355 | 43,113 | 117,882 | |
Not In Work Force | 2,073 | 16,026 | 48,794 | |
Workforce Employed | 5,101 | 40,715 | 111,654 | |
Workforce Unemployed | 188 | 1,845 | 4,627 | |
Civlian Workforce | 5,289 | 42,561 | 116,282 | |
Military Workforce | 66 | 552 | 1,600 | |
Total Households | 3,501 | 27,891 | 75,340 | |
Family Households | 2,217 | 18,553 | 52,049 | |
Non-Family Households | 1,283 | 9,338 | 23,291 | |
Married Couple | 1,644 | 14,326 | 39,284 | |
Other Family | 573 | 4,227 | 12,765 | |
Married w/Child | 785 | 6,700 | 18,508 | |
Single Male w/Child | 61 | 343 | 1,319 | |
Single Female w/Child | 194 | 1,706 | 5,132 |
Population Change Last Two Decades - Plus Projection
2000 | % | 2010 | % | 2020 | % | 2030 | |
---|---|---|---|---|---|---|---|
Maryland | 5,296,486 | +9 | 5,773,552 | +6 | 6,141,900 | +6 | 6,518,750 |
Anne Arundel County | 489,656 | +10 | 537,656 | +7 | 573,250 | +4 | 596,700 |
Baltimore County | 754,292 | +7 | 805,029 | +5 | 847,000 | +2 | 862,200 |
Howard County | 247,842 | +16 | 287,085 | +17 | 336,900 | +9 | 366,800 |
Montgomery County | 873,341 | +11 | 971,777 | +8 | 1,052,050 | +7 | 1,128,800 |
Prince Georges County | 801,515 | +8 | 863,420 | +6 | 916,150 | +4 | 952,950 |
Total Working Age Population:
Total Households:
Total Working Age Population:
Total Households:
Total Working Age Population:
Total Households: