Highlights:
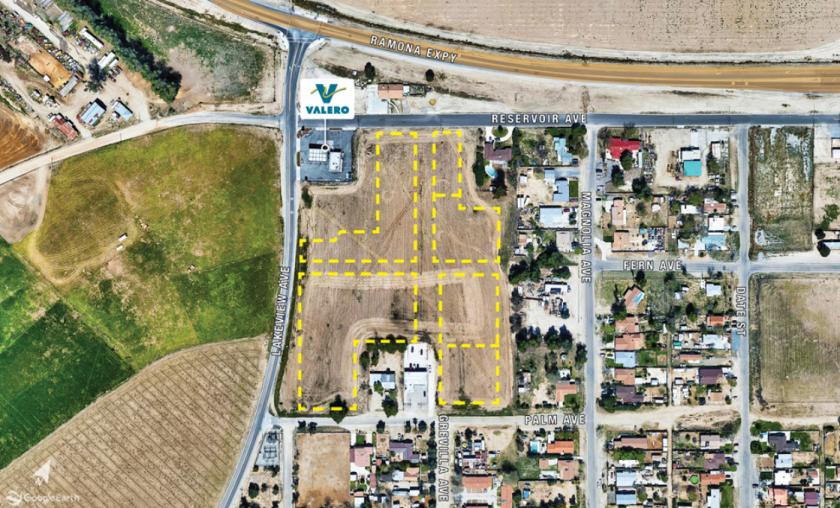
-Vacant Land - 5 Separate Lots APN: 426-092-006, 426-092-002, 426-074-005, 426-073-009, 426-091-001 (Commercial Land)
-Potential to increase property size to dismiss road, additional land of about 1 ½ acres.
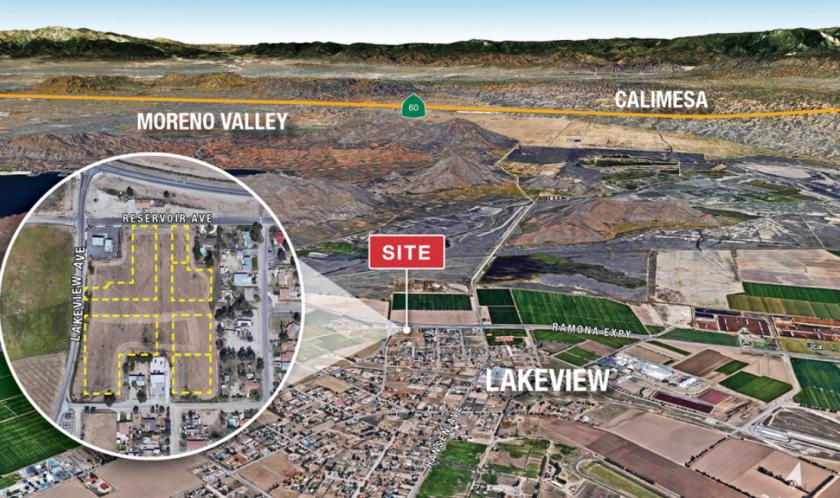
-Part of Unincorporated Perris – County of Riverside (Lakeview Area)
-Planned Mid-County Parkway – Freeway Planned along Ramona Expressway
-Great Location
-Adjacent to a Valero Gas station
-Zoned MU – Mixed Use – Retail/Residential
-Great for many retail uses
No part of this information may be copied, reproduced, repurposed, or screen-captured for any commercial purpose without prior written authorization from MyEListing.
While we strive to provide the most accurate information, all listing information, and demographic data, is provided by third-parties. As such, MyEListing will not be responsible for the accuracy of the information. It is strongly recommended that you verify all information with the listing agent, and any relevant agencies, prior to making any decisions.
What is the asking price for 19560 Lakeview Ave in Nuevo?
The asking price for 19560 Lakeview Ave is $890,000
How much land does the Nuevo, CA property at 19560 Lakeview Ave include?
19560 Lakeview Ave in Nuevo includes 6.030 acres of land
What kind of Land is the propery at 19560 Lakeview Ave?
The property at 19560 Lakeview Ave Nuevo, CA 92567 is listed as a Mixed Use Land Land property
What is the population within 1 mile of 19560 Lakeview Ave in Nuevo?
The population within 1 mile of 19560 Lakeview Ave Nuevo, CA 92567 is 1,271 people.
Who do I contact for questions about 19560 Lakeview Ave?
You should contact the listing agent,
Don Archer, for any details regarding this commercial listing.