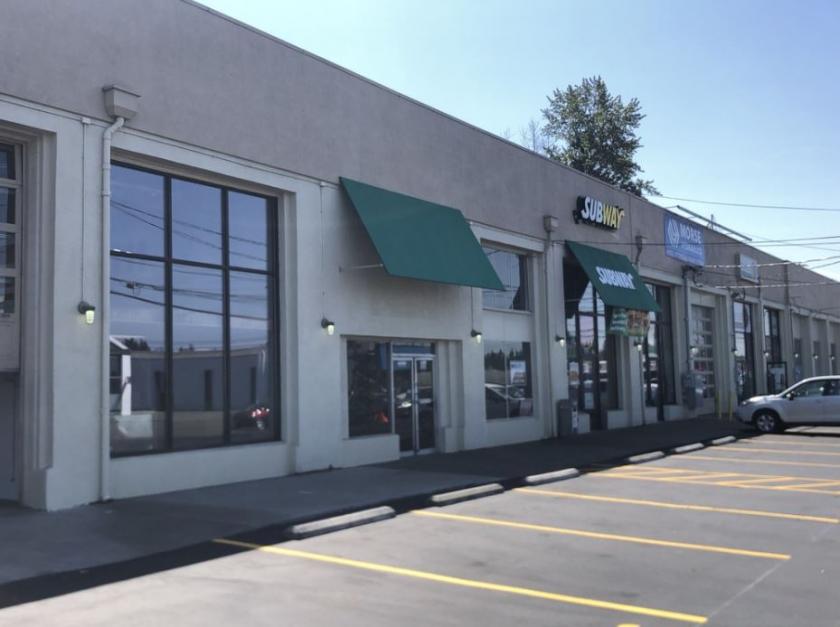
Retail Space
2628 South Tacoma Way Tacoma, WA 98409
2628 South Tacoma Way Tacoma, WA 98409
Details & Description
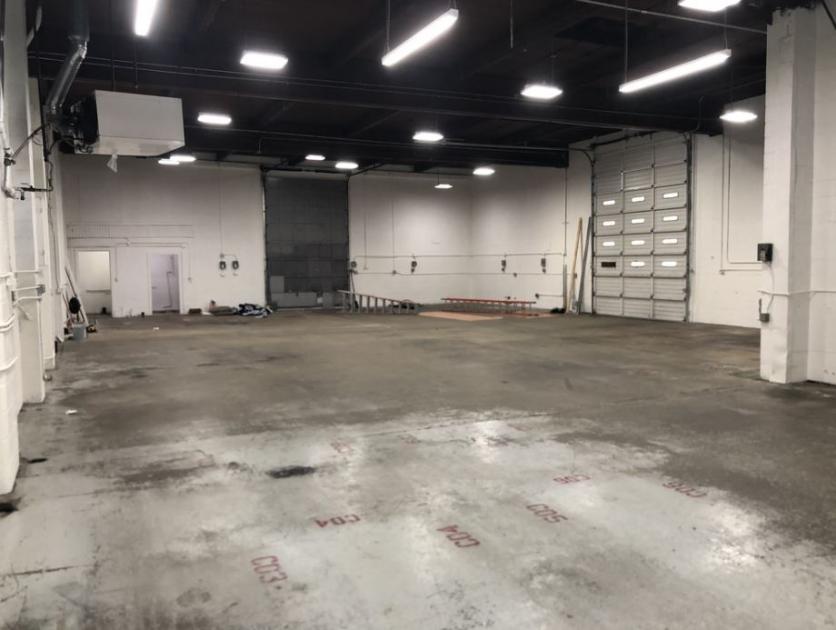
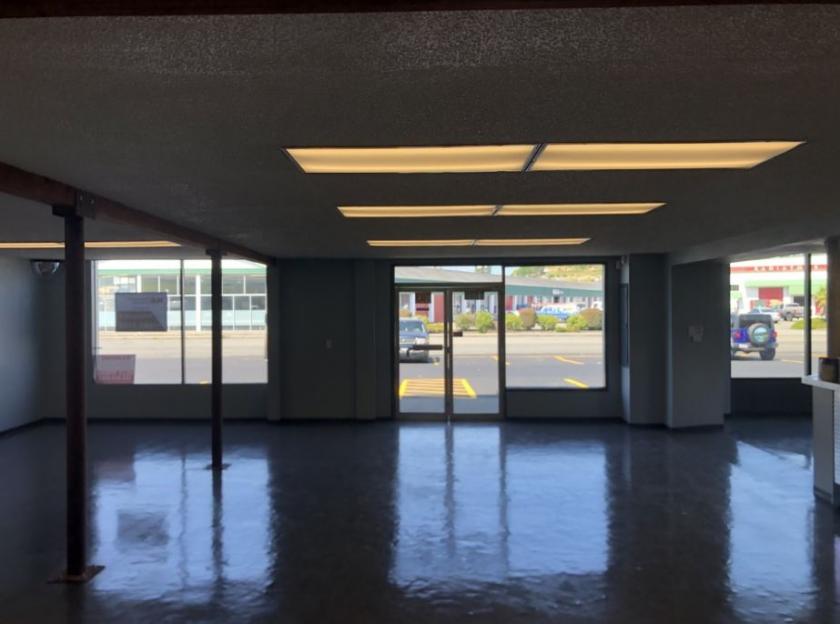
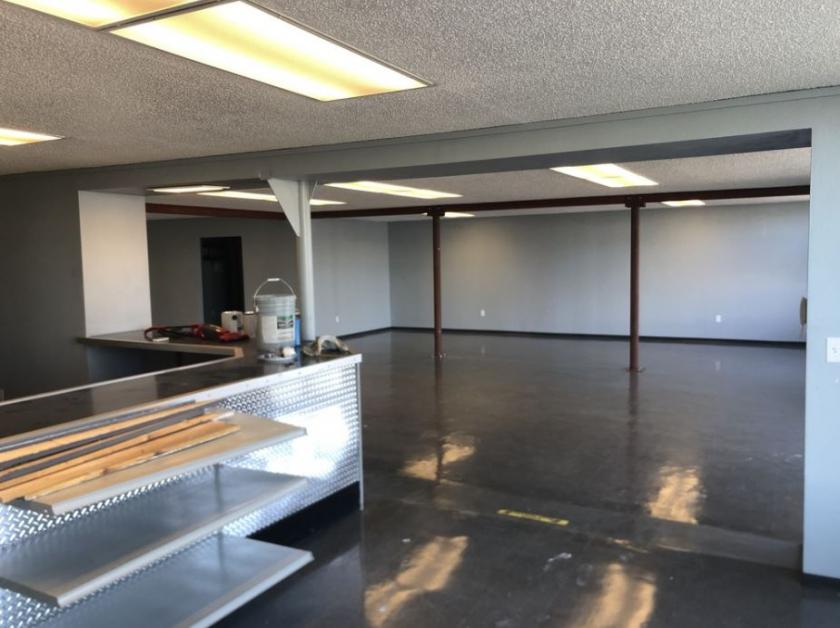
Additional Photos
Listing Agents

Kyle Schipper
O: 253-203-1320
M: 425-417-5477
kschipper@nai-psp.com
O: 253-203-1320
M: 425-417-5477
kschipper@nai-psp.com

Dave Douglas
O: 253-203-1326
M: 253-208-2277
ddouglas@nai-psp.com
O: 253-203-1326
M: 253-208-2277
ddouglas@nai-psp.com
While we strive to provide the most accurate information, all listing information, and demographic data, is provided by third-parties. As such, MyEListing will not be responsible for the accuracy of the information. It is strongly recommended that you verify all information with the listing agent, and any relevant agencies, prior to making any decisions.


