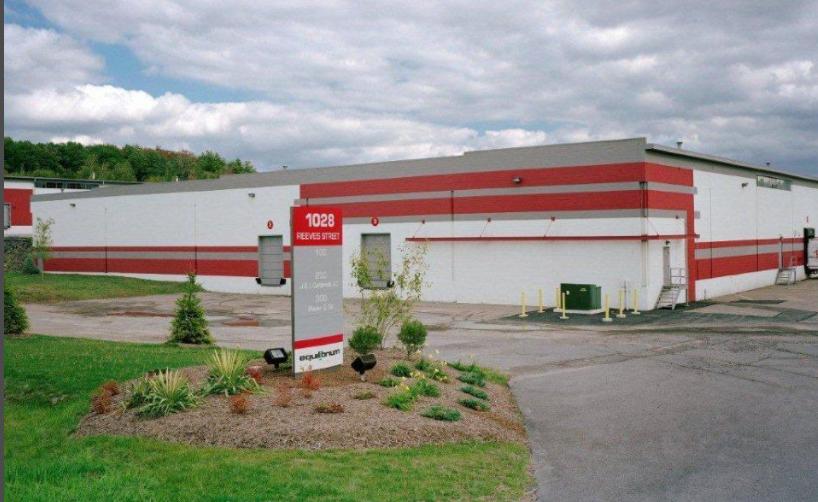
Prime 445,751 SF multi-tenant Warehouse / Distribution facility. Strategically located within 1 mile of highway interchanges. Two lease spaces available with ample dockage.
Highlights:
Combined Total SF - 445,751
21.11 Acre Site
Ceiling Height - 20'
Clear Span - 33' 4" X 40'
6" Reinforced concrete Floors
Full coverage wet Sprinkler System
Power - 3 phase, 400 amps per 60,000 SF
Gas fired wall hung space heaters
Public Utilities
North Building - 1026
29,238 SF'
4 Dock Doors w/ 2 levelers
South Building - 1028
13,433 SF
2 Dock Doors each w/ leveler
No part of this information may be copied, reproduced, repurposed, or screen-captured for any commercial purpose without prior written authorization from MyEListing.
While we strive to provide the most accurate information, all listing information, and demographic data, is provided by third-parties. As such, MyEListing will not be responsible for the accuracy of the information. It is strongly recommended that you verify all information with the listing agent, and any relevant agencies, prior to making any decisions.
What is the building size of this commercial Industrial property?
The size of this lease property at '.1028 Reeves Street.' is 13433 square feet
What kind of Industrial is the propery at 1028 Reeves Street?
The property at 1028 Reeves Street Dunmore, PA 18512 is listed as a Flex-Office-Warehouse Industrial property
What is the population within 1 mile of 1028 Reeves Street in Dunmore?
The population within 1 mile of 1028 Reeves Street Dunmore, PA 18512 is 4,140 people.
Who do I contact for questions about 1028 Reeves Street?
You should contact the listing agent,
Steve Cole, for any details regarding this commercial listing.