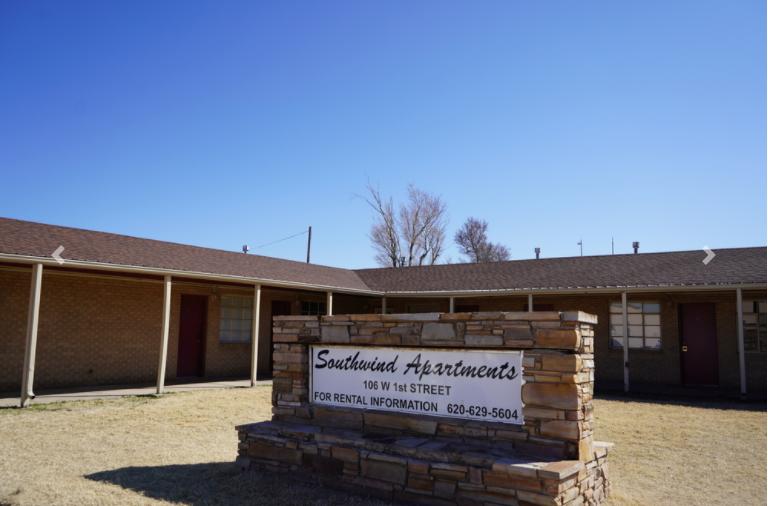
Multifamily Housing
106 West 1st Street Liberal, KS 67901
106 West 1st Street Liberal, KS 67901
Details & Description
Property Highlights
- • Fully Occupied 13-Unit Apartment Complex
- • 13-Unit Multifamily Complex
- • Fully Occupied
- • Good Management in Place
- • Strong Cap Rate
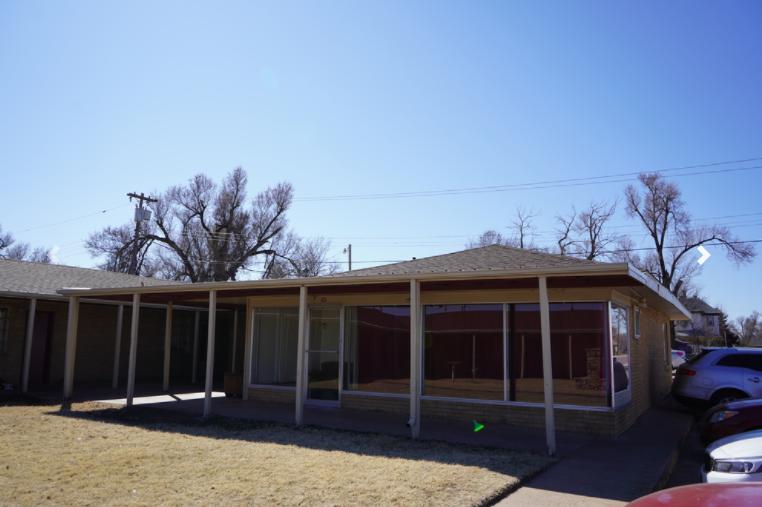
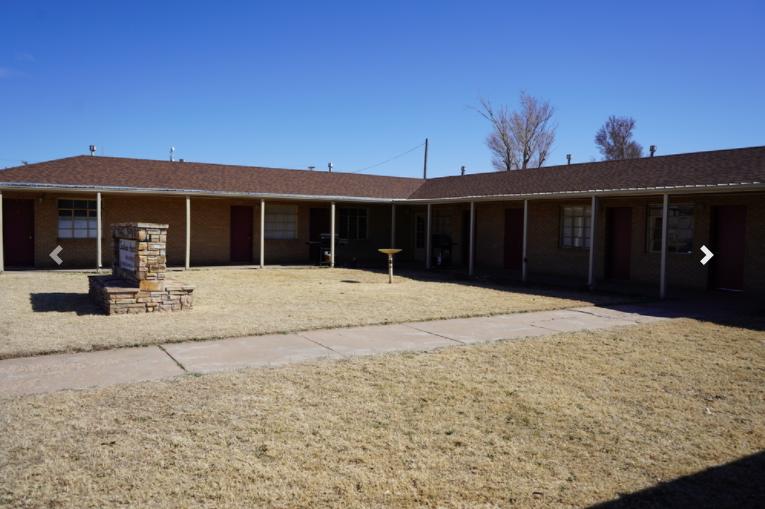
Additional Photos

Listing Agents

Trent Garman
O: 316-613-2447
M: 316-210-2061
tgarman@naimartens.com
O: 316-613-2447
M: 316-210-2061
tgarman@naimartens.com

Jeff Englert
O: 316-847-4924
M: 316-214-3436
jenglert@naimartens.com
O: 316-847-4924
M: 316-214-3436
jenglert@naimartens.com
While we strive to provide the most accurate information, all listing information, and demographic data, is provided by third-parties. As such, MyEListing will not be responsible for the accuracy of the information. It is strongly recommended that you verify all information with the listing agent, and any relevant agencies, prior to making any decisions.


