Retail Space
2304 Oliver Wichita, KS 67218
2304 Oliver Wichita, KS 67218
Details & Description
Property Highlights
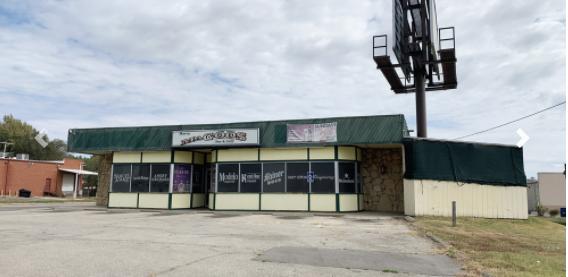
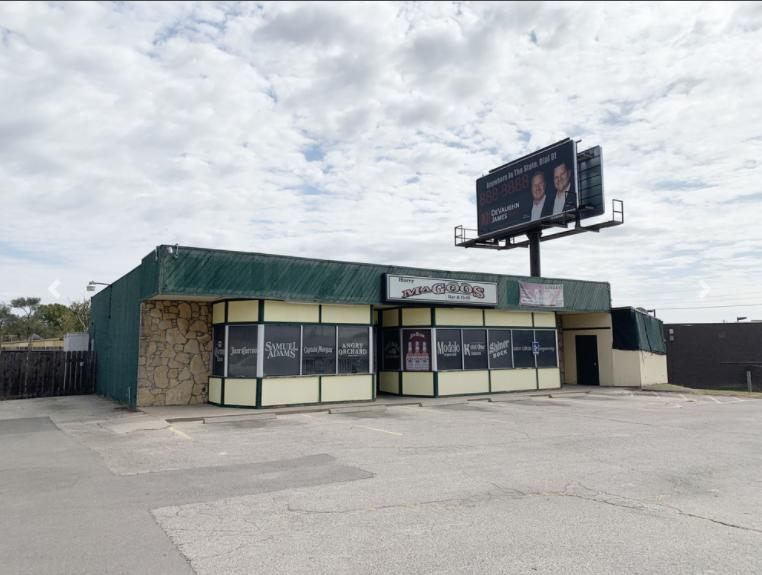
- • 2,689 SF Free-Standing Bar and Grill
- • Fully Equipped with Commercial Kitchen
- • Great Visibility to South Oliver
- • Covered Outdoor Patio
- • Abundant amount of Parking
Listing Agents

Trent Garman
O: 316-613-2447
M: 316-210-2061
tgarman@naimartens.com
O: 316-613-2447
M: 316-210-2061
tgarman@naimartens.com
While we strive to provide the most accurate information, all listing information, and demographic data, is provided by third-parties. As such, MyEListing will not be responsible for the accuracy of the information. It is strongly recommended that you verify all information with the listing agent, and any relevant agencies, prior to making any decisions.