Office Space
202 Pacific Avenue Bremerton, WA 98337
202 Pacific Avenue Bremerton, WA 98337

Details & Description
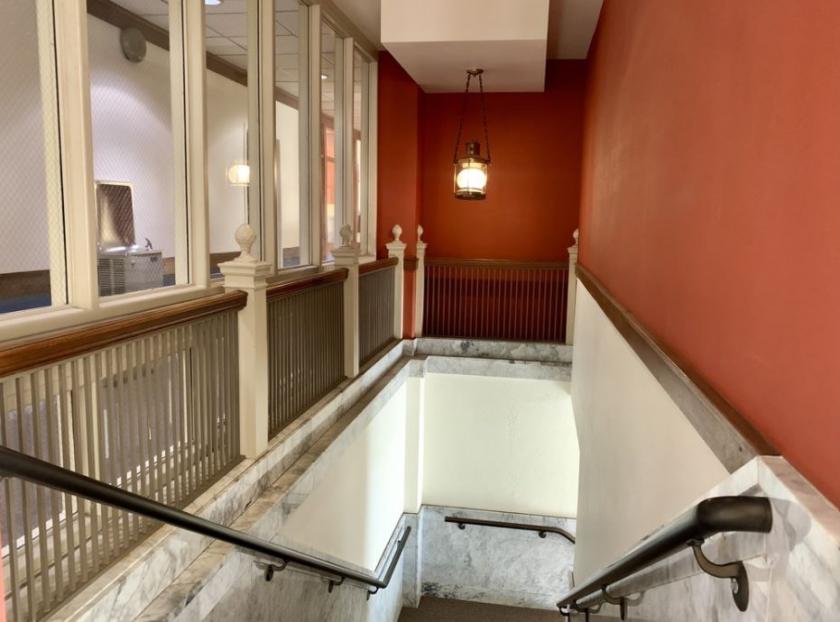
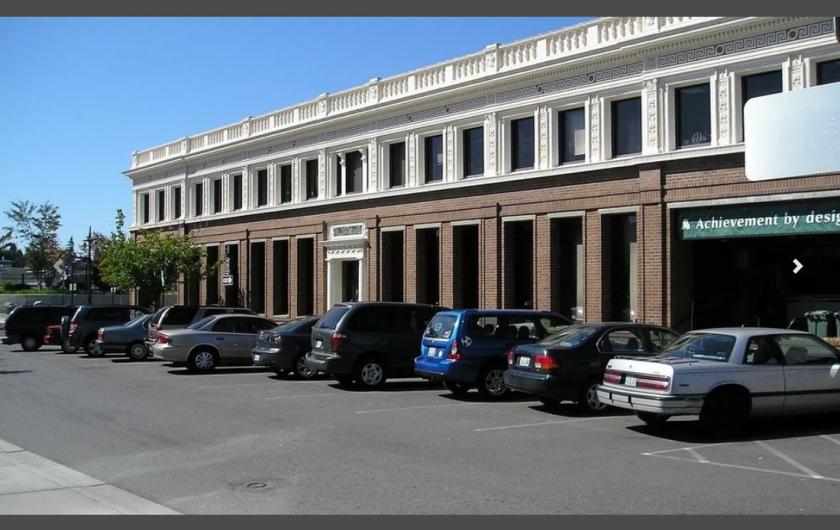
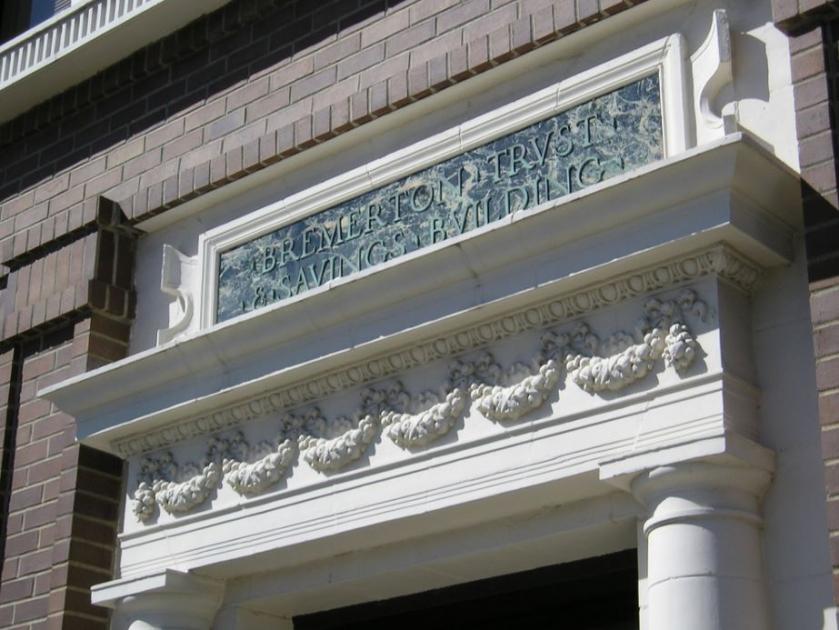
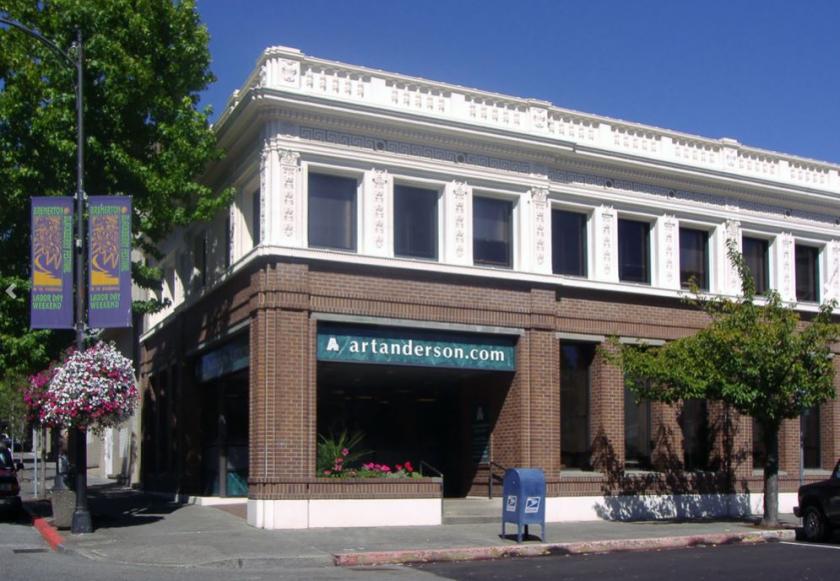
Additional Photos
Listing Agents

Kim Marvik
O: 253-203-1325
M: 253-312-0482
kmarvik@nai-psp.com
O: 253-203-1325
M: 253-312-0482
kmarvik@nai-psp.com

Gloria Fletcher
O: 253-203-1324
M: 253-223-9176
gfletcher@nai-psp.com
O: 253-203-1324
M: 253-223-9176
gfletcher@nai-psp.com
While we strive to provide the most accurate information, all listing information, and demographic data, is provided by third-parties. As such, MyEListing will not be responsible for the accuracy of the information. It is strongly recommended that you verify all information with the listing agent, and any relevant agencies, prior to making any decisions.


