Industrial Properties
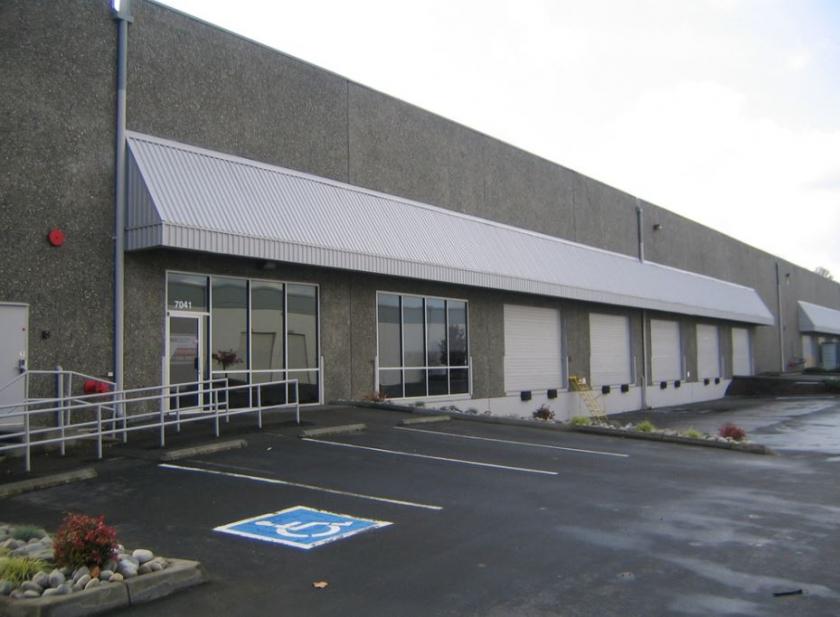
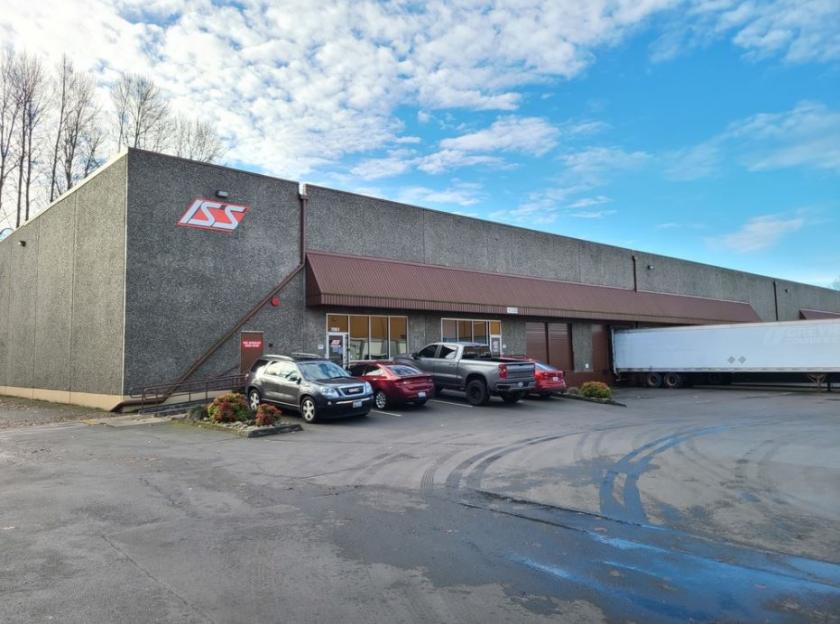
7051 South 234th Street Kent, WA 98032
7051 South 234th Street Kent, WA 98032
Details & Description
Listing Agents

Kent Channing
O: 425-586-5628
M: 206-369-2565
kchanning@nai-psp.com
O: 425-586-5628
M: 206-369-2565
kchanning@nai-psp.com

Jeff Forsberg
O: 425-586-5610
M: 206-310-3841
jforsberg@nai-psp.com
O: 425-586-5610
M: 206-310-3841
jforsberg@nai-psp.com
While we strive to provide the most accurate information, all listing information, and demographic data, is provided by third-parties. As such, MyEListing will not be responsible for the accuracy of the information. It is strongly recommended that you verify all information with the listing agent, and any relevant agencies, prior to making any decisions.