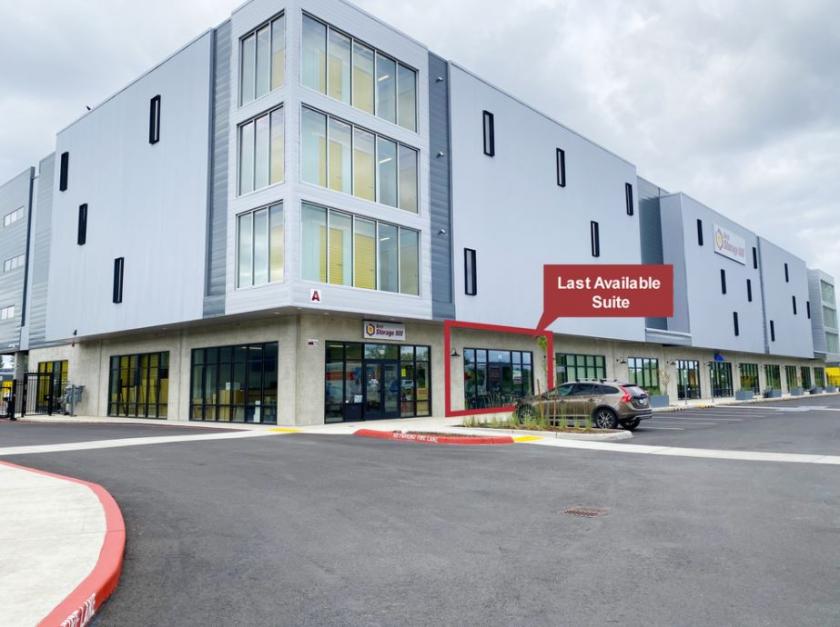
Retail Space
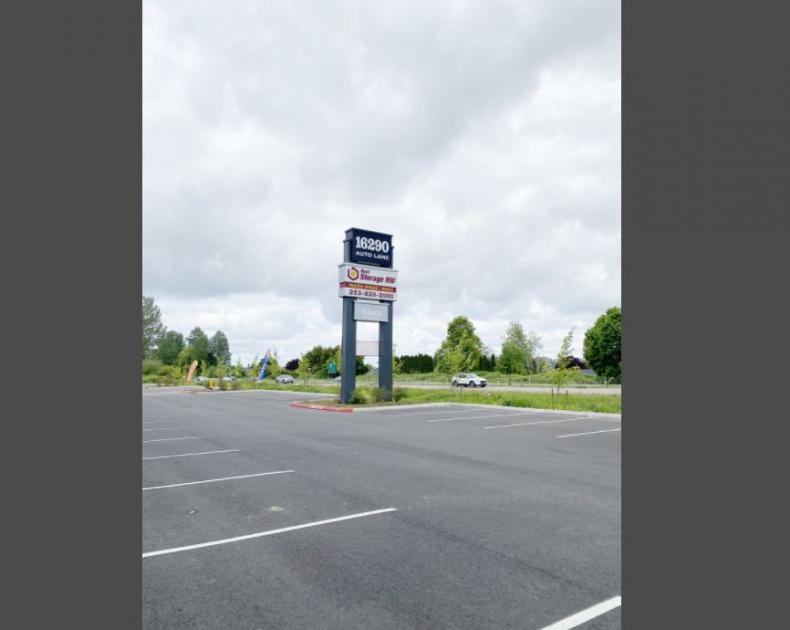
16290 Auto Lane Sumner, WA 98390
16290 Auto Lane Sumner, WA 98390
Details & Description
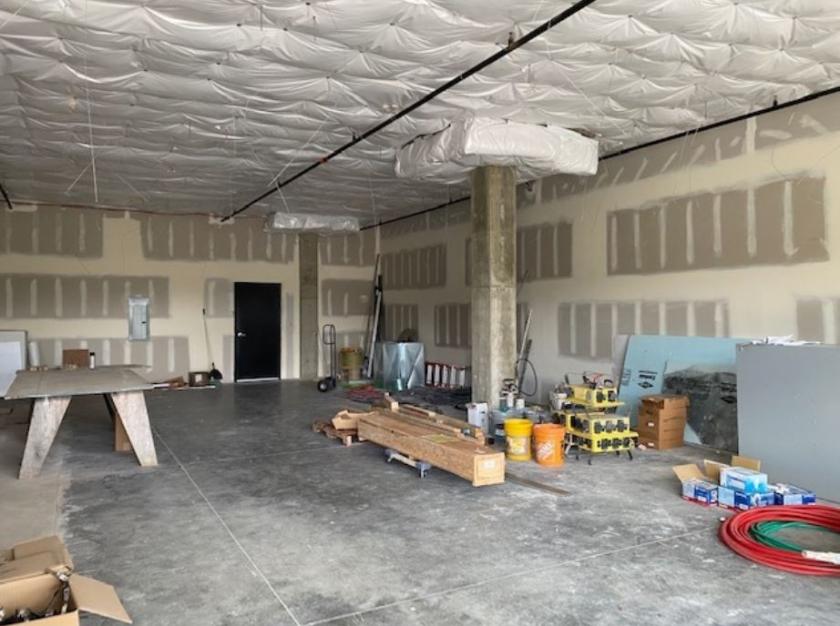
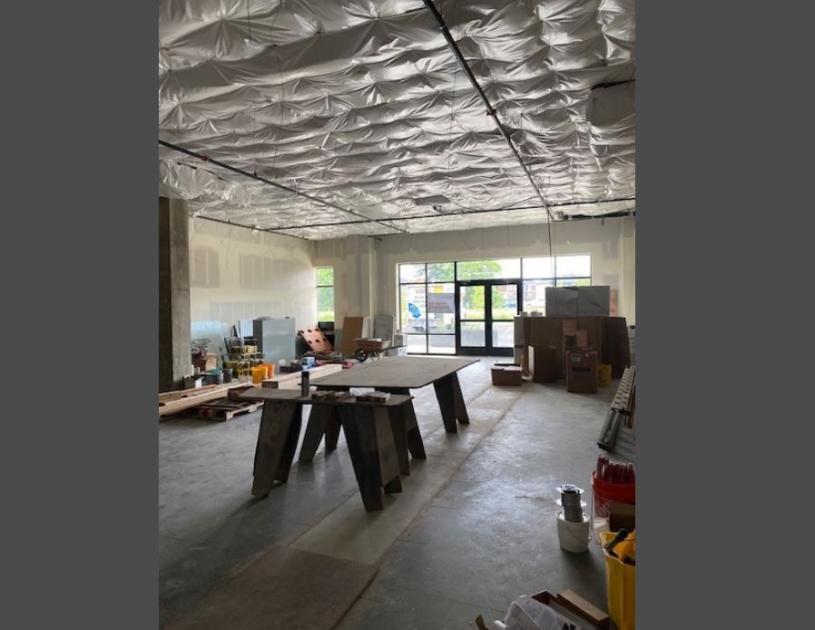
Additional Photos
Listing Agents

Gloria Fletcher
O: 253-203-1324
M: 253-223-9176
gfletcher@nai-psp.com
O: 253-203-1324
M: 253-223-9176
gfletcher@nai-psp.com

Aaron Rosen
O: 253-203-1319
M: 253-606-5942
arosen@nai-psp.com
O: 253-203-1319
M: 253-606-5942
arosen@nai-psp.com
While we strive to provide the most accurate information, all listing information, and demographic data, is provided by third-parties. As such, MyEListing will not be responsible for the accuracy of the information. It is strongly recommended that you verify all information with the listing agent, and any relevant agencies, prior to making any decisions.


