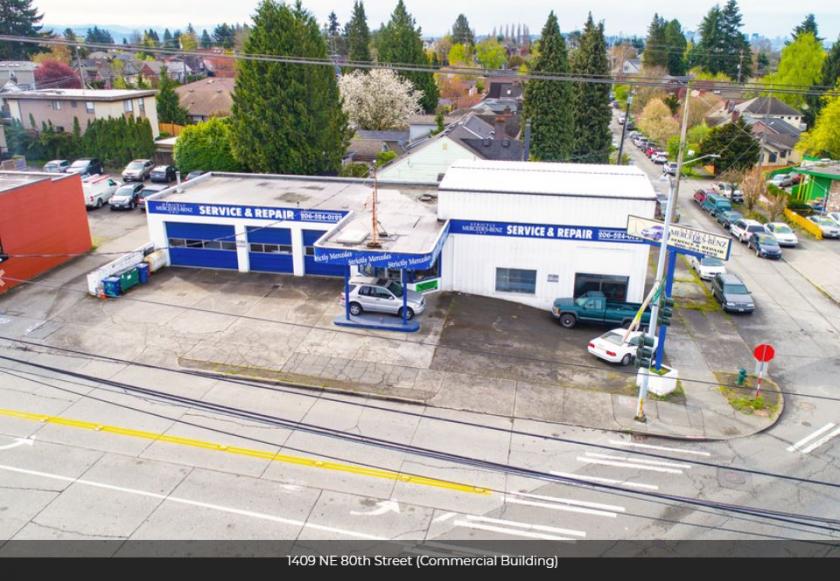
1-Mile | 3-Miles | 5-Miles | ||
---|---|---|---|---|
Total Population | 32,684 | 252,426 | 574,914 | |
Population Median Age | 37 | 37 | 38 | |
Population by Age | 0-9 Yrs | 3518 (10%) | 23521 (9%) | 50719 (8%) |
10-19 Yrs | 2321 (7%) | 26202 (10%) | 51253 (8%) | |
20-29 Yrs | 7283 (22%) | 57740 (22%) | 120404 (20%) | |
30-39 Yrs | 6118 (18%) | 44918 (17%) | 104894 (18%) | |
40-49 Yrs | 4354 (13%) | 32036 (12%) | 75337 (13%) | |
50-59 Yrs | 3581 (10%) | 25513 (10%) | 64393 (11%) | |
60-69 Yrs | 3357 (10%) | 23979 (9%) | 59060 (10%) | |
70+ Yrs | 2152 (6%) | 18517 (7%) | 48855 (8%) | |
Median HH Income | $110,527 | $94,022 | $99,980 | |
Total Household Income | < 24K | 1686 (12%) | 14732 (13%) | 30793 (11%) |
25-49K | 1545 (11%) | 14598 (13%) | 35128 (13%) | |
50-74K | 1552 (11%) | 14889 (13%) | 34748 (13%) | |
75-99K | 1527 (10%) | 12132 (11%) | 30868 (11%) | |
100-199K | 4534 (32%) | 29744 (27%) | 76870 (29%) | |
200K+ | 3041 (21%) | 20806 (19%) | 54623 (20%) | |
Highest Education Level | No Diploma | 311 | 5261 | 11538 |
Diploma or GED | 1091 | 12327 | 31234 | |
Some College | 3260 | 23220 | 58423 | |
Assoc. Degree | 1271 | 10412 | 24186 | |
Bachelors Degree | 9887 | 66209 | 167338 | |
Higher Degree | 8074 | 56616 | 130953 | |
Total Housing Units | 14,294 | 112,984 | 279,115 | |
--Owner-Occupied | 7,654 | 54,680 | 128,196 | |
--Renter-Occupied | 6,229 | 52,220 | 134,834 | |
Owner-Occupied Values | < 100K | 25 | 435 | 1274 |
100-199K | 42 | 788 | 1790 | |
200-299K | 256 | 2098 | 5385 | |
300-399K | 322 | 3542 | 9429 | |
400-499K | 887 | 5000 | 11378 | |
500K+ | 6122 | 42817 | 98940 | |
Total Working Age Population | 27,749 | 217,364 | 497,743 | |
In Work Force | 21,092 | 156,288 | 362,232 | |
Not In Work Force | 6,657 | 61,076 | 135,511 | |
Workforce Employed | 20,126 | 149,659 | 348,030 | |
Workforce Unemployed | 927 | 6,485 | 13,654 | |
Civlian Workforce | 21,053 | 156,144 | 361,684 | |
Military Workforce | 39 | 144 | 548 | |
Total Households | 13,883 | 106,900 | 263,030 | |
Family Households | 6,752 | 51,573 | 123,046 | |
Non-Family Households | 7,131 | 55,327 | 139,984 | |
Married Couple | 5,593 | 42,682 | 102,751 | |
Other Family | 1,159 | 8,892 | 20,294 | |
Married w/Child | 2,588 | 18,216 | 40,442 | |
Single Male w/Child | 286 | 1,590 | 3,326 | |
Single Female w/Child | 269 | 2,956 | 7,028 |
Population Change Last Two Decades - Plus Projection
2000 | % | 2010 | % | 2020 | % | 2030 | |
---|---|---|---|---|---|---|---|
Washington | 5,894,121 | +14 | 6,724,540 | +14 | 7,638,415 | +11 | 8,503,178 |
King County | 1,737,034 | +11 | 1,931,249 | +16 | 2,231,408 | +11 | 2,474,625 |
Total Working Age Population:
Total Households:
Total Working Age Population:
Total Households:
Total Working Age Population:
Total Households: