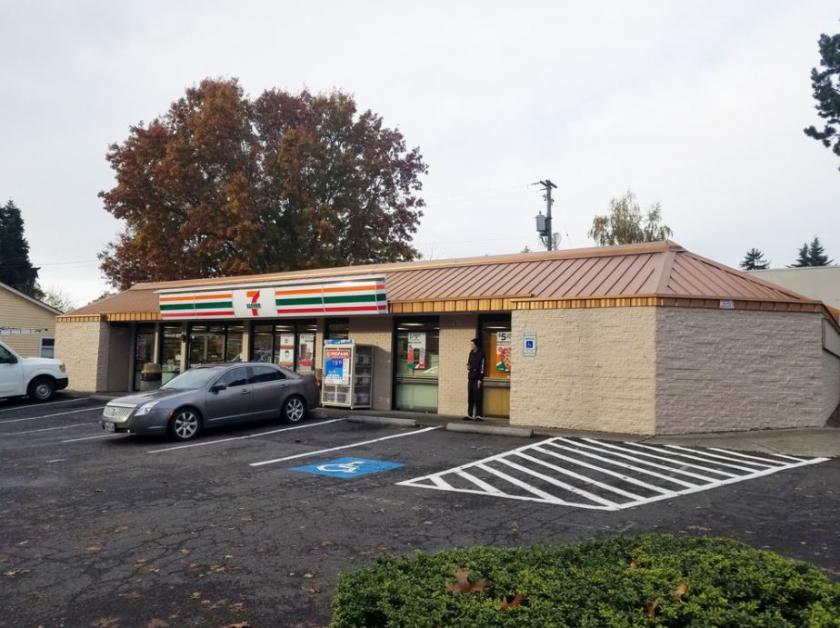
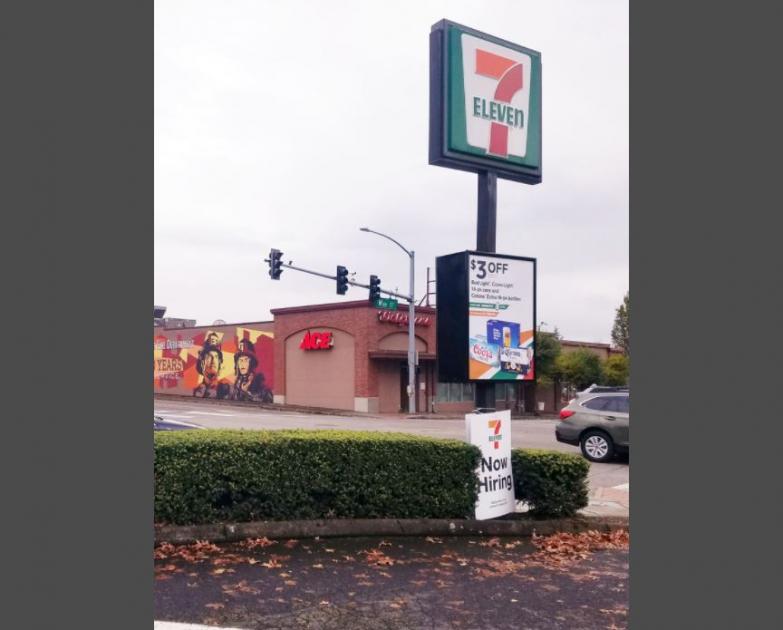
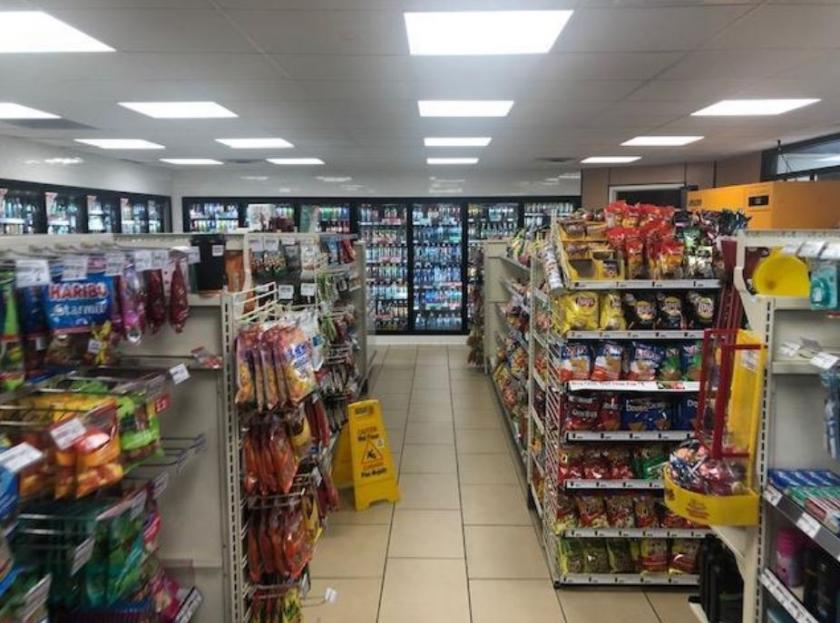
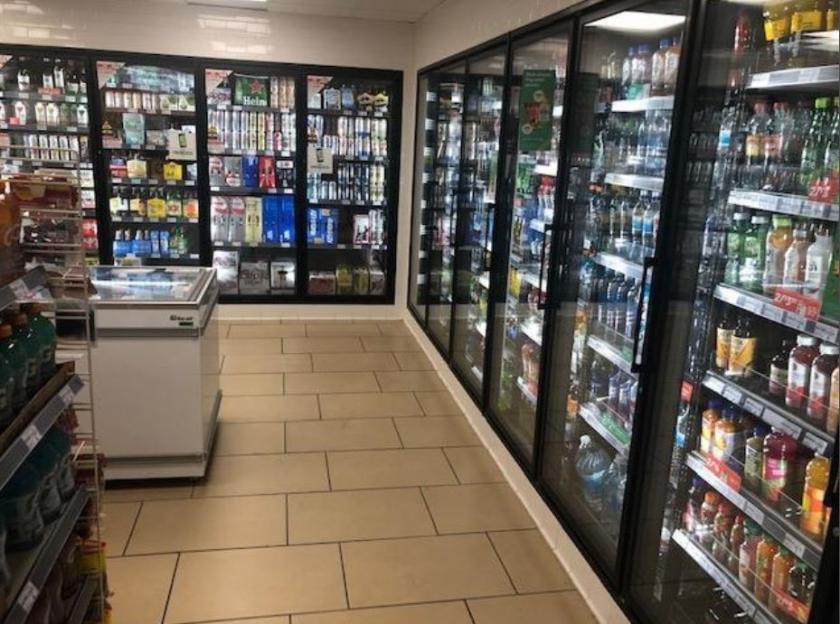
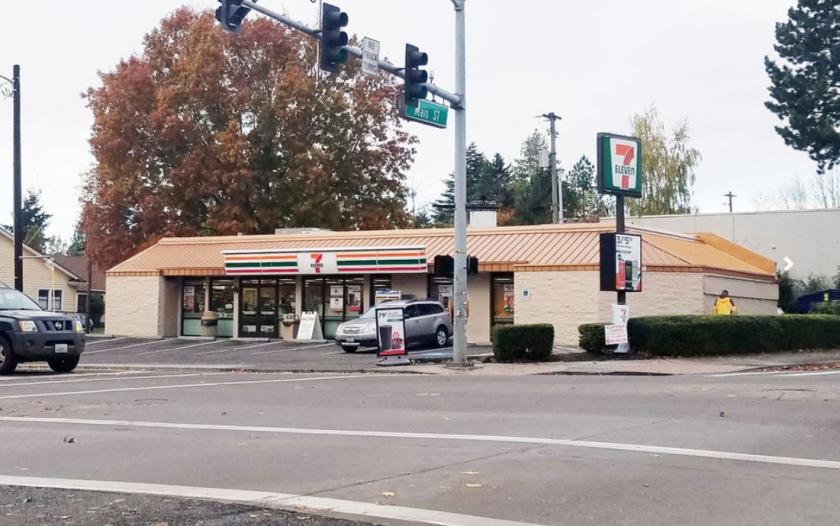
1-Mile | 3-Miles | 5-Miles | ||
---|---|---|---|---|
Total Population | 16,682 | 76,248 | 210,269 | |
Population Median Age | 39 | 39 | 38 | |
Population by Age | 0-9 Yrs | 1953 (11%) | 9300 (12%) | 25825 (12%) |
10-19 Yrs | 1355 (8%) | 7426 (9%) | 23107 (10%) | |
20-29 Yrs | 2699 (16%) | 11080 (14%) | 30219 (14%) | |
30-39 Yrs | 3198 (19%) | 11941 (15%) | 34061 (16%) | |
40-49 Yrs | 2086 (12%) | 9343 (12%) | 27729 (13%) | |
50-59 Yrs | 2120 (12%) | 10528 (13%) | 26408 (12%) | |
60-69 Yrs | 1860 (11%) | 9045 (11%) | 22898 (10%) | |
70+ Yrs | 1411 (8%) | 7585 (9%) | 20022 (9%) | |
Median HH Income | $52,221 | $57,362 | $64,969 | |
Total Household Income | < 24K | 1794 (24%) | 6627 (20%) | 14256 (17%) |
25-49K | 1724 (23%) | 7575 (23%) | 17405 (20%) | |
50-74K | 1211 (16%) | 6174 (18%) | 16082 (19%) | |
75-99K | 913 (12%) | 4208 (12%) | 11464 (13%) | |
100-199K | 1364 (18%) | 6596 (20%) | 19737 (23%) | |
200K+ | 267 (3%) | 1379 (4%) | 4456 (5%) | |
Highest Education Level | No Diploma | 1197 | 5443 | 13791 |
Diploma or GED | 2786 | 13415 | 33687 | |
Some College | 3281 | 15136 | 38288 | |
Assoc. Degree | 1149 | 5729 | 14528 | |
Bachelors Degree | 2610 | 9523 | 31975 | |
Higher Degree | 1391 | 6023 | 16826 | |
Total Housing Units | 7,758 | 35,103 | 88,041 | |
--Owner-Occupied | 3,202 | 15,964 | 47,784 | |
--Renter-Occupied | 4,072 | 16,595 | 35,615 | |
Owner-Occupied Values | < 100K | 30 | 1157 | 2122 |
100-199K | 598 | 3034 | 5860 | |
200-299K | 1084 | 4978 | 14559 | |
300-399K | 949 | 3978 | 13885 | |
400-499K | 299 | 1605 | 6577 | |
500K+ | 241 | 1213 | 4781 | |
Total Working Age Population | 13,941 | 62,598 | 170,462 | |
In Work Force | 8,895 | 40,916 | 113,311 | |
Not In Work Force | 5,046 | 21,682 | 57,151 | |
Workforce Employed | 8,438 | 39,011 | 107,583 | |
Workforce Unemployed | 432 | 1,852 | 5,534 | |
Civlian Workforce | 8,870 | 40,863 | 113,116 | |
Military Workforce | 25 | 52 | 195 | |
Total Households | 7,273 | 32,559 | 83,399 | |
Family Households | 3,422 | 17,631 | 49,076 | |
Non-Family Households | 3,852 | 14,928 | 34,323 | |
Married Couple | 2,308 | 11,874 | 35,085 | |
Other Family | 1,113 | 5,757 | 13,992 | |
Married w/Child | 991 | 4,304 | 13,600 | |
Single Male w/Child | 232 | 1,001 | 2,317 | |
Single Female w/Child | 436 | 1,934 | 4,856 |
Population Change Last Two Decades - Plus Projection
2000 | % | 2010 | % | 2020 | % | 2030 | |
---|---|---|---|---|---|---|---|
Oregon | 3,421,399 | +12 | 3,831,074 | +11 | 4,264,810 | +11 | 4,727,438 |
Multnomah County | 660,486 | +11 | 735,334 | +12 | 822,675 | +10 | 906,904 |
Washington County | 445,342 | +19 | 529,710 | +17 | 619,337 | +16 | 718,633 |
Washington | 5,894,121 | +14 | 6,724,540 | +14 | 7,638,415 | +11 | 8,503,178 |
Clark County | 345,238 | +23 | 425,363 | +17 | 499,400 | +16 | 576,879 |
Total Working Age Population:
Total Households:
Total Working Age Population:
Total Households:
Total Working Age Population:
Total Households: