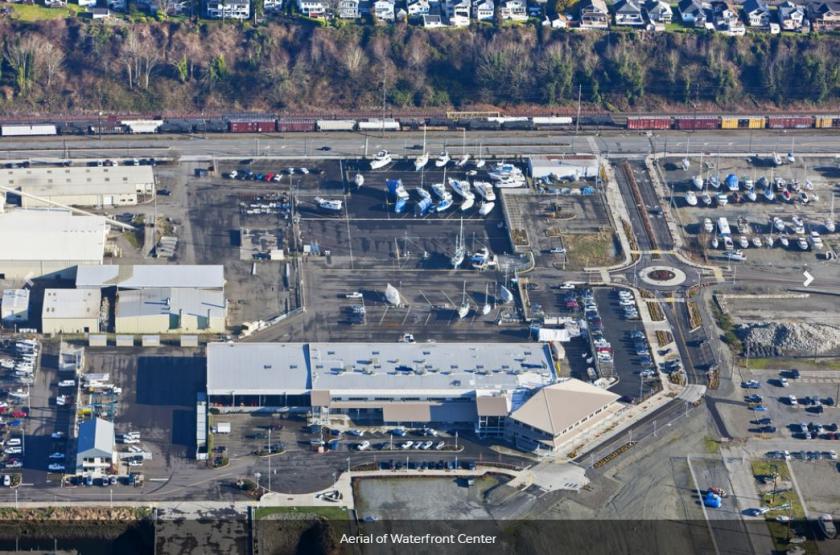
Waterside office suites with waterfront views
Restaurants within wheelchair and walking distance
Abundant parking
Plenty of level wheelchair and walking paths/sidewalks
Walking/wheelchair access to and from Everett’s NW Neighborhood via the new Grand Avenue pedestrian bridge
Adjacent summertime access via foot ferry, kayak or boat to Jetty Island. A beautiful sand-laden beach with unrestricted sunsets and world-class kiteboarding conditions.
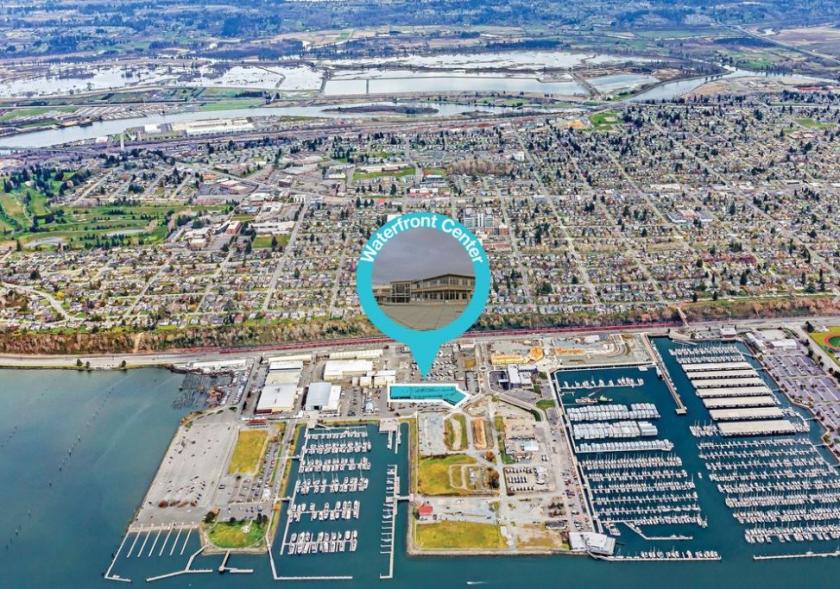
Immediately adjacent to the largest public marina on the west coast
Waterfront Center has easy access to Interstate 5 using several major City of Everett arterials
Property adjacent to “Naval Station Everett” Navy complex
Reasonable rates & terms
No part of this information may be copied, reproduced, repurposed, or screen-captured for any commercial purpose without prior written authorization from MyEListing.
While we strive to provide the most accurate information, all listing information, and demographic data, is provided by third-parties. As such, MyEListing will not be responsible for the accuracy of the information. It is strongly recommended that you verify all information with the listing agent, and any relevant agencies, prior to making any decisions.
What is the asking price for 1205 Craftsman Way in Everett?
The asking price for 1205 Craftsman Way is $28.60 a SF per Year
What is the building size of this commercial Retail property?
The size of this lease property at '.1205 Craftsman Way.' is 1421 square feet
What kind of Retail is the propery at 1205 Craftsman Way?
The property at 1205 Craftsman Way Everett, WA 98201 is listed as a Other Retail Retail property
What is the population within 1 mile of 1205 Craftsman Way in Everett?
The population within 1 mile of 1205 Craftsman Way Everett, WA 98201 is 11,611 people.
Who do I contact for questions about 1205 Craftsman Way?
You should contact the listing agent,
Art Thomson, for any details regarding this commercial listing.