Commercial Land
7107 West 37th Street North Wichita, KS 67205
7107 West 37th Street North Wichita, KS 67205
Details & Description
Property Highlights
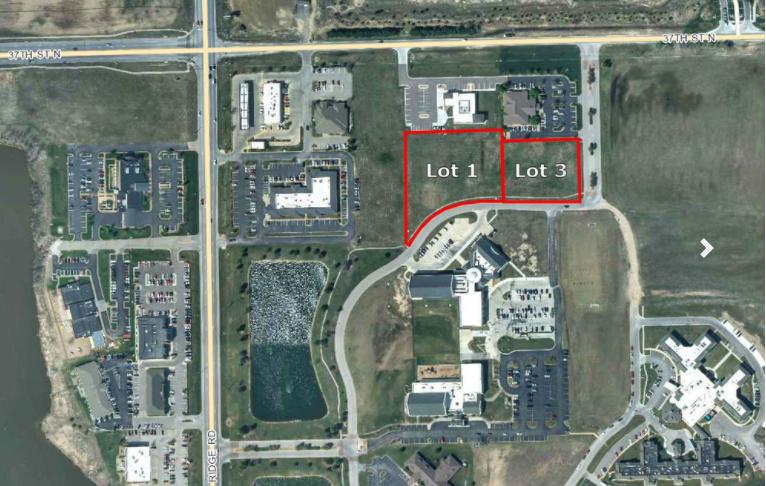
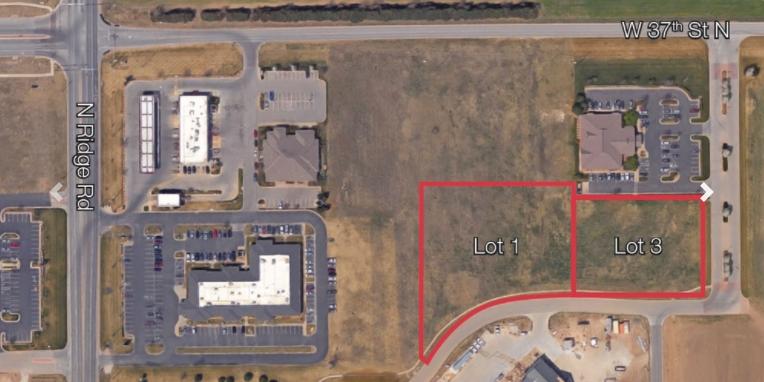
• Lot 1 88,111 sq. ft. 2.02 acres
• Lot 3 51,742 sq. ft. 1.19 acres
Listing Agents

Ryan Hubbard
O: 316-613-2448
M: 316-990-2994
rhubbard@naimartens.com
O: 316-613-2448
M: 316-990-2994
rhubbard@naimartens.com
While we strive to provide the most accurate information, all listing information, and demographic data, is provided by third-parties. As such, MyEListing will not be responsible for the accuracy of the information. It is strongly recommended that you verify all information with the listing agent, and any relevant agencies, prior to making any decisions.