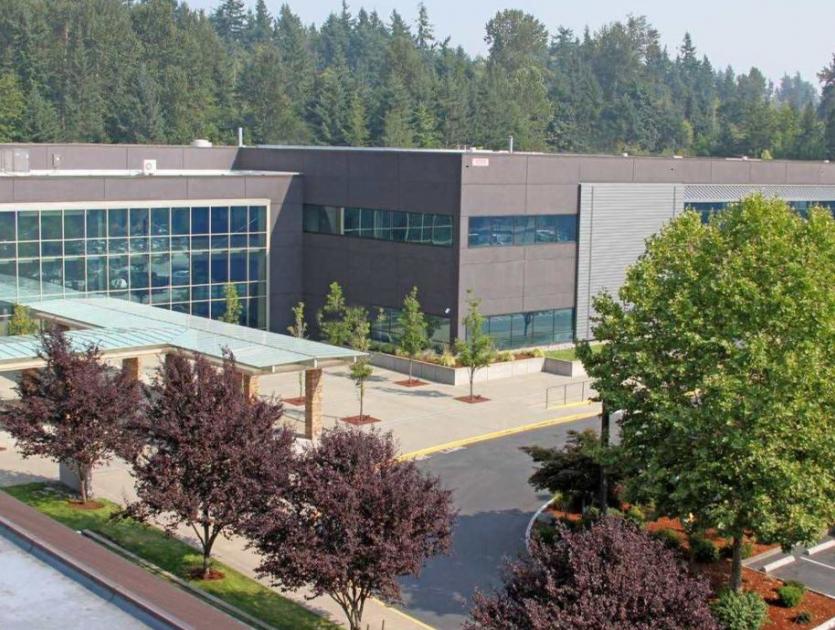
Office Space
1015 39th Avenue Southeast Puyallup, WA 98374
1015 39th Avenue Southeast Puyallup, WA 98374
Details & Description
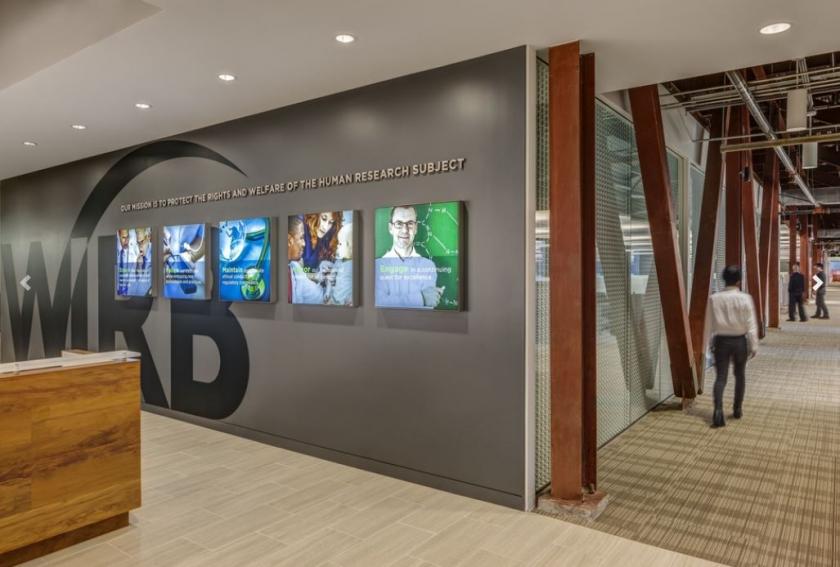
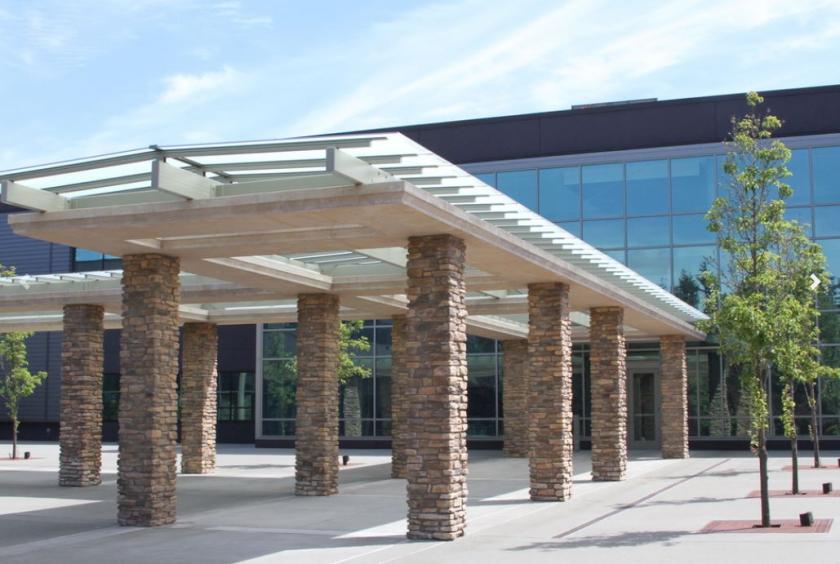
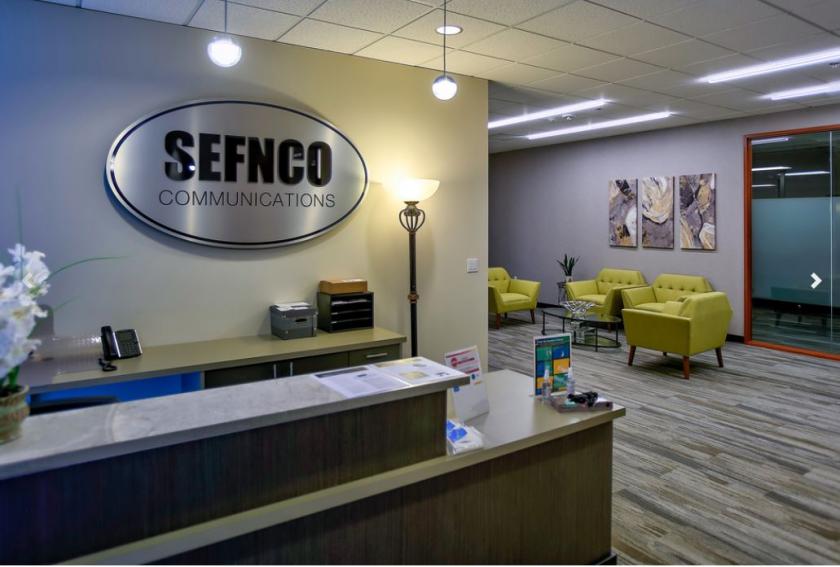
Additional Photos

Listing Agents

Mike George
O: 425-586-5618
M: 206-999-5449
mgeorge@nai-psp.com
O: 425-586-5618
M: 206-999-5449
mgeorge@nai-psp.com

Scott Sulman
O: 425-586-5647
ssulman@nai-psp.com
O: 425-586-5647
ssulman@nai-psp.com
While we strive to provide the most accurate information, all listing information, and demographic data, is provided by third-parties. As such, MyEListing will not be responsible for the accuracy of the information. It is strongly recommended that you verify all information with the listing agent, and any relevant agencies, prior to making any decisions.


