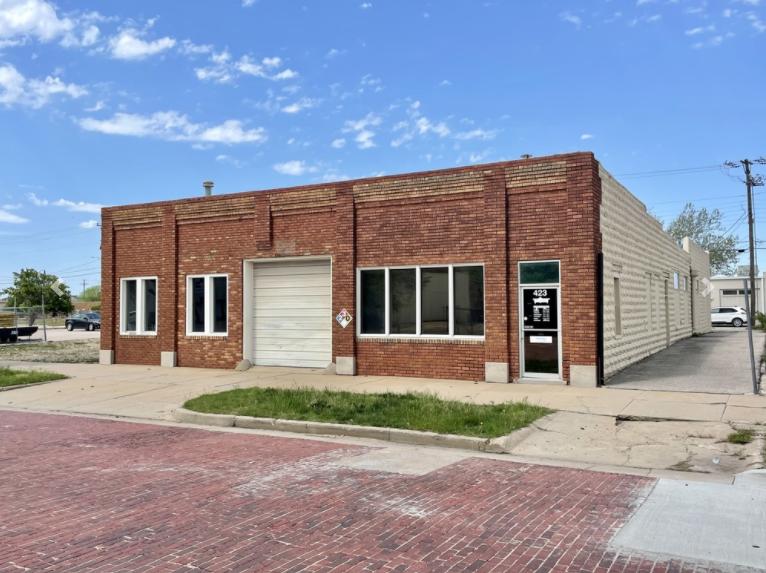
Flex-Office-Warehouse
423 Saint Francis Wichita, KS 67202
423 Saint Francis Wichita, KS 67202
Details & Description
Property Highlights
• Two overhead garage doors 10 x 10
• 3-Phase, 400 amp electrical
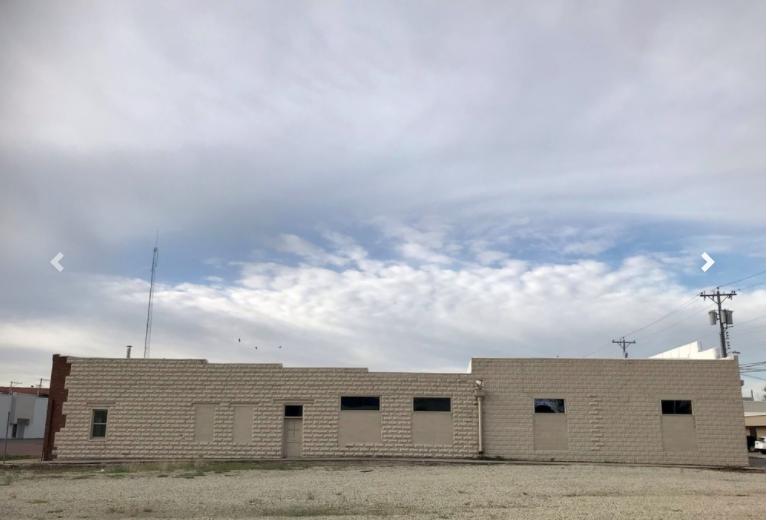
Additional Photos


Listing Agents

Ryan Hubbard
O: 316-613-2448
M: 316-990-2994
rhubbard@naimartens.com
O: 316-613-2448
M: 316-990-2994
rhubbard@naimartens.com

Nathan Farha
O: 316-263-9669
M: 316-807-3250
nfarha@naimartens.com
O: 316-263-9669
M: 316-807-3250
nfarha@naimartens.com
While we strive to provide the most accurate information, all listing information, and demographic data, is provided by third-parties. As such, MyEListing will not be responsible for the accuracy of the information. It is strongly recommended that you verify all information with the listing agent, and any relevant agencies, prior to making any decisions.


