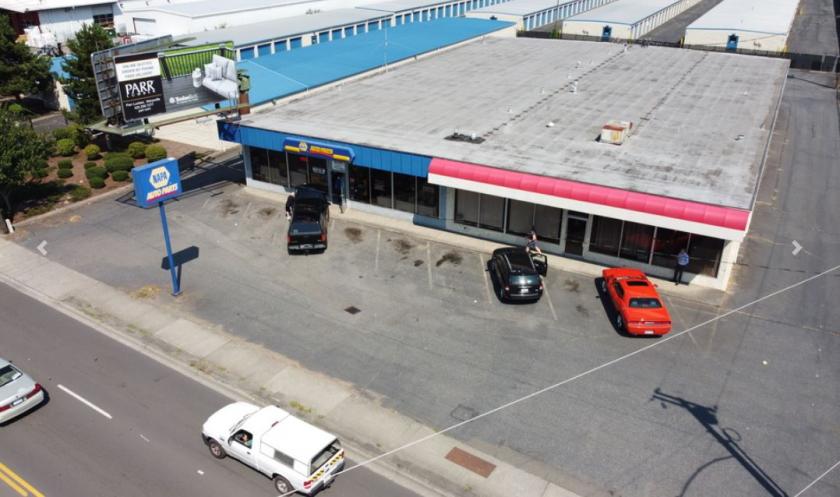
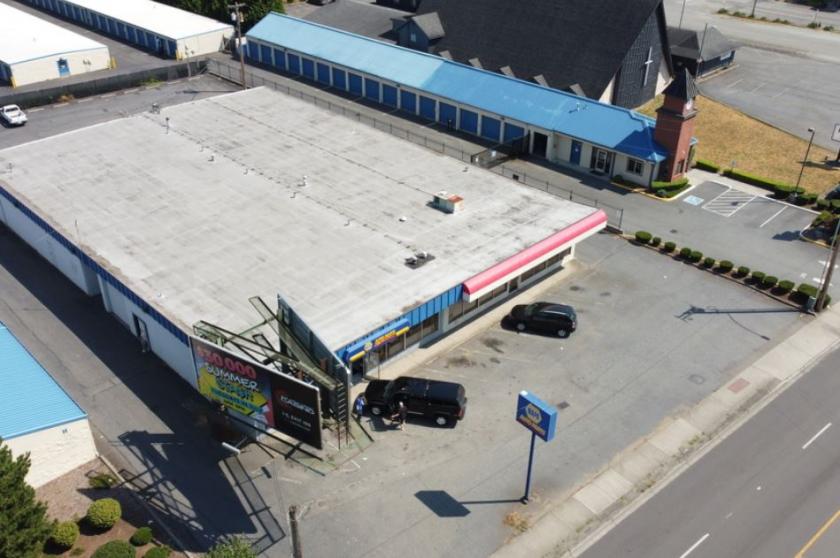
NAI Puget Sound Properties is pleased to offer for sale NAPA Auto Parts, a 12,171-square-foot retail center located at 8213 State Avenue in Marysville, Washington.The property is situated on a .75-acre lot zoned CB and is 100% occupied by the sole tenant, NAPA Auto Parts, Genuine Parts Company. NAPA is a leading auto parts retailer with over 6,000 retail locations and over 16,000 AutoCare & Collision Centers throughout the United States.NAPA Auto Parts has 3 years remaining on their NNN lease, with two 1-year options to extend. The lease provides 3% annual increases throughout the term. The tenant is currently paying below market rent, providing an investor with future upside potential upon re-leasing. In addition, the listing price represents $127.35 per square foot, which is far below replacement cost. The property is also subject to a billboard lease that provides an additional $3,427.00 / year with 2% annual rental increases.This offering allows an investor to purchase a rare western Washington single-tenant asset with a strong corporate tenant and upside, while still achieving high as-is returns.The property is ideally located on State Avenue, a main arterial with average traffic counts of 21,800 vehicles per day. Additionally, the property is located close to an I-5 on/off ramp, which provides convenient accessibility and boasts traffic counts of over 117,000 vehicles per day. The trade area is surrounded by a vibrant mix of large national retailers such as Walmart, Fred Meyer, Safeway, Home Depot, Cabela’s, and the Seattle Premium Outlets.8213 State Avenue is being offered for sale at $1,550,000, which equates to a 6.41% capitalization rate.