Industrial Properties
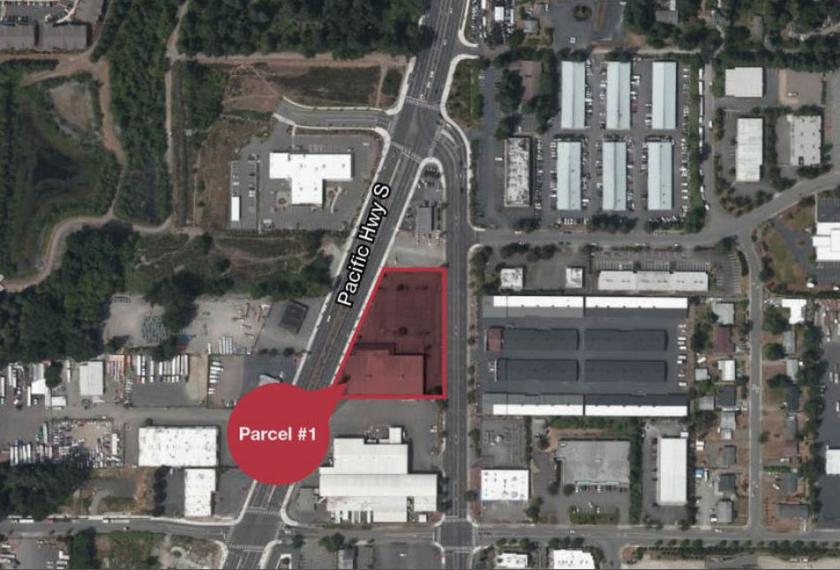
34222 Pacific Highway South Federal Way, WA 98003
34222 Pacific Highway South Federal Way, WA 98003
Details & Description
Listing Agents

Kyle Sterling
O: 425-586-5608
M: 206-930-2658
ksterling@nai-psp.com
O: 425-586-5608
M: 206-930-2658
ksterling@nai-psp.com

Dave Douglas
O: 253-203-1326
M: 253-208-2277
ddouglas@nai-psp.com
O: 253-203-1326
M: 253-208-2277
ddouglas@nai-psp.com

Nick Bierly
O: 425-586-5631
M: 206-612-0655
nbierly@nai-psp.com
O: 425-586-5631
M: 206-612-0655
nbierly@nai-psp.com
While we strive to provide the most accurate information, all listing information, and demographic data, is provided by third-parties. As such, MyEListing will not be responsible for the accuracy of the information. It is strongly recommended that you verify all information with the listing agent, and any relevant agencies, prior to making any decisions.