Industrial Properties
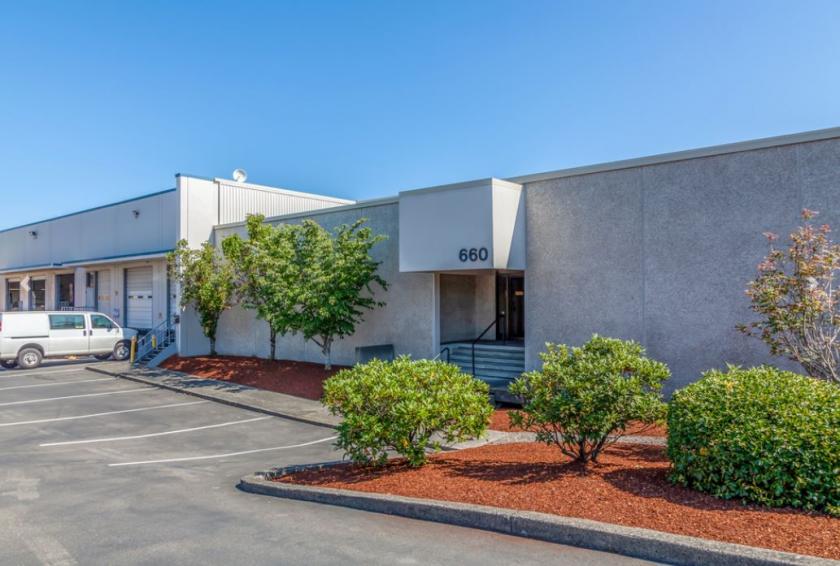
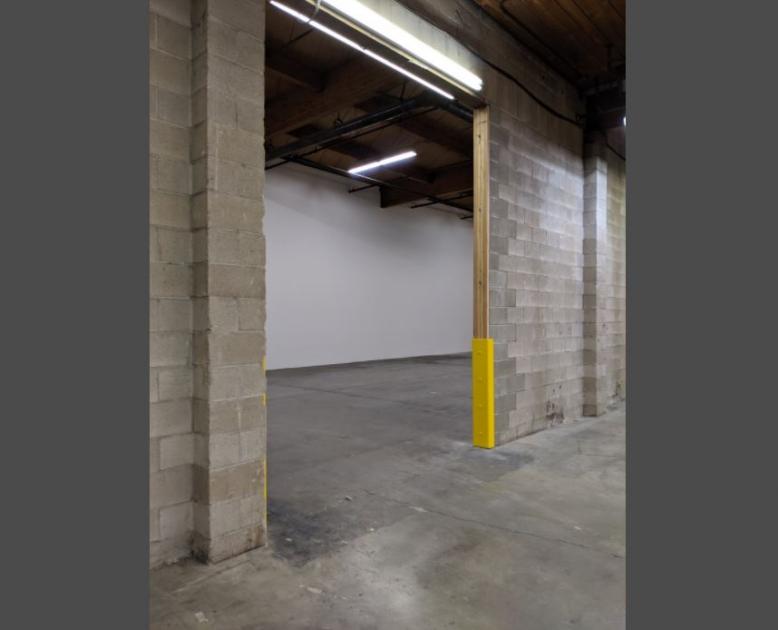
660 South Industrial Way Seattle, WA 98108
660 South Industrial Way Seattle, WA 98108
Details & Description
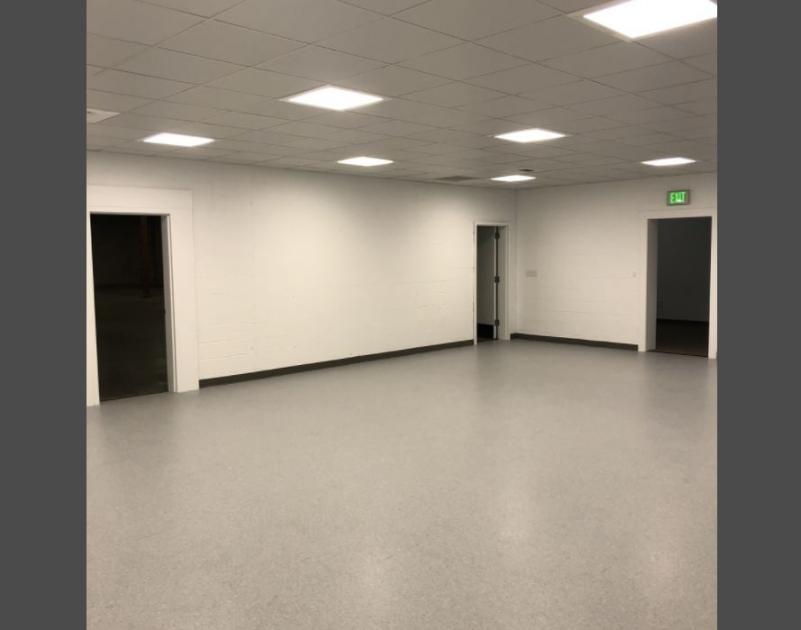
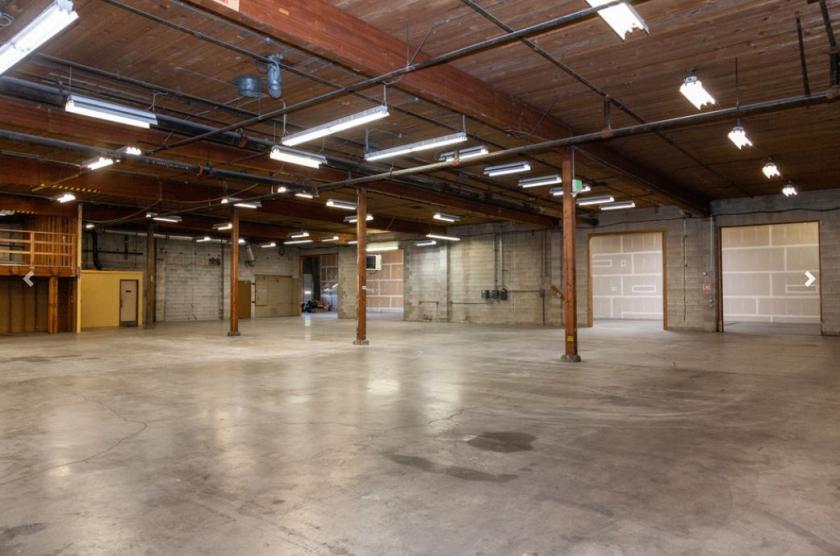
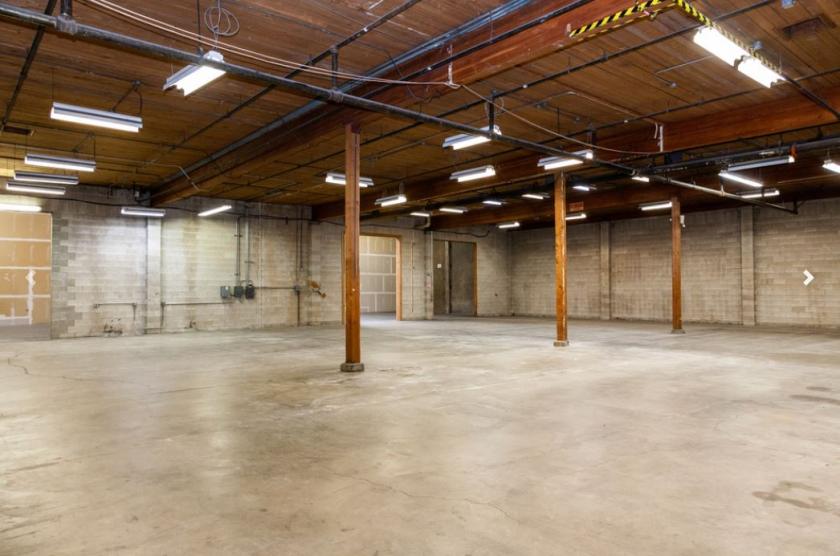
Additional Photos
Listing Agents

John Vernon
O: 425-586-5638
M: 206-550-6520
jvernon@nai-psp.com
O: 425-586-5638
M: 206-550-6520
jvernon@nai-psp.com

Hans Swenson
O: 425-586-5630
M: 360-927-1989
hswenson@nai-psp.com
O: 425-586-5630
M: 360-927-1989
hswenson@nai-psp.com
While we strive to provide the most accurate information, all listing information, and demographic data, is provided by third-parties. As such, MyEListing will not be responsible for the accuracy of the information. It is strongly recommended that you verify all information with the listing agent, and any relevant agencies, prior to making any decisions.


