Specialty Real Estate
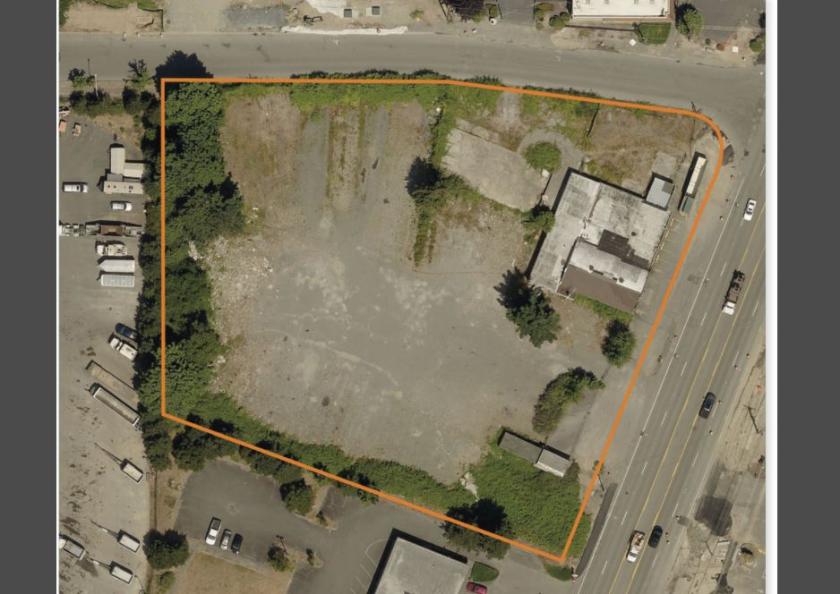
34413 Pacific Highway South Federal Way, WA 98003
34413 Pacific Highway South Federal Way, WA 98003
Details & Description
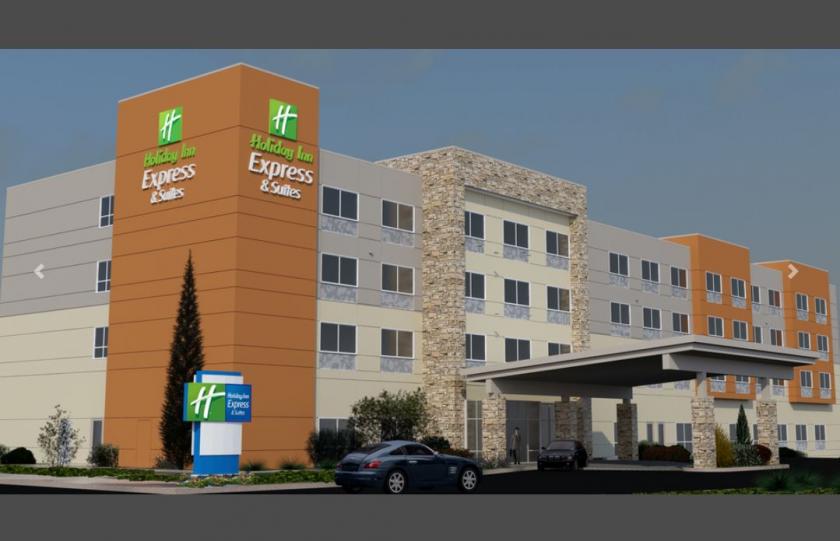
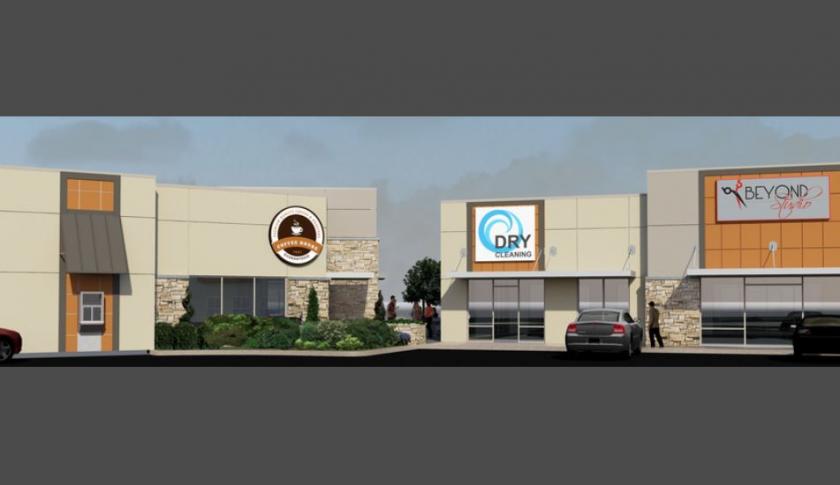
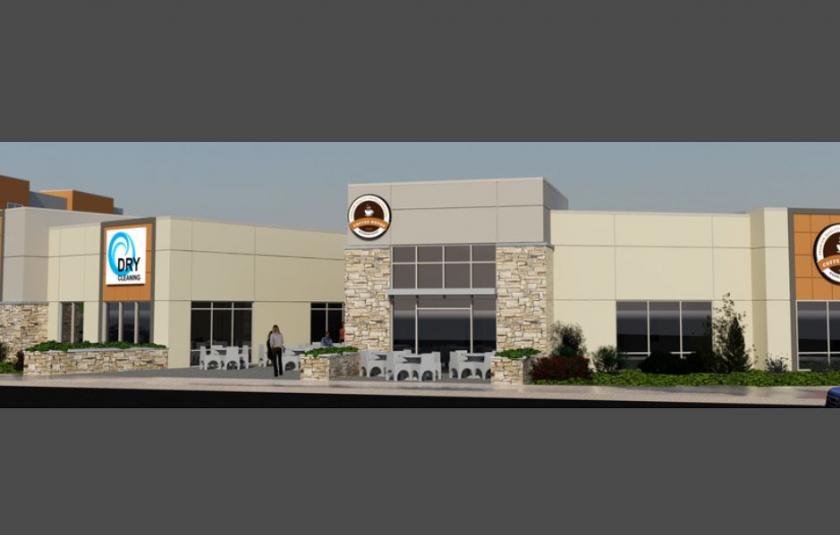
Additional Photos
Listing Agents

Itzik Mizrahi
O: 425-586-5637
M: 206-579-1370
imizrahi@nai-psp.com
O: 425-586-5637
M: 206-579-1370
imizrahi@nai-psp.com

Bruce Goldstein
O: 425-586-5632
M: 206-972-6650
bgoldstein@nai-psp.com
O: 425-586-5632
M: 206-972-6650
bgoldstein@nai-psp.com
While we strive to provide the most accurate information, all listing information, and demographic data, is provided by third-parties. As such, MyEListing will not be responsible for the accuracy of the information. It is strongly recommended that you verify all information with the listing agent, and any relevant agencies, prior to making any decisions.


