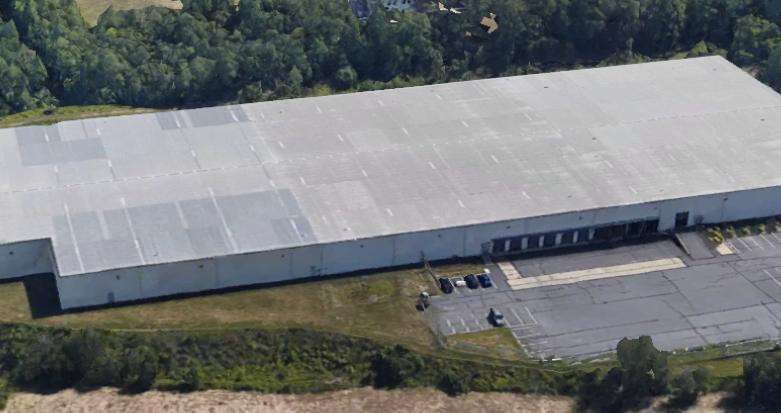
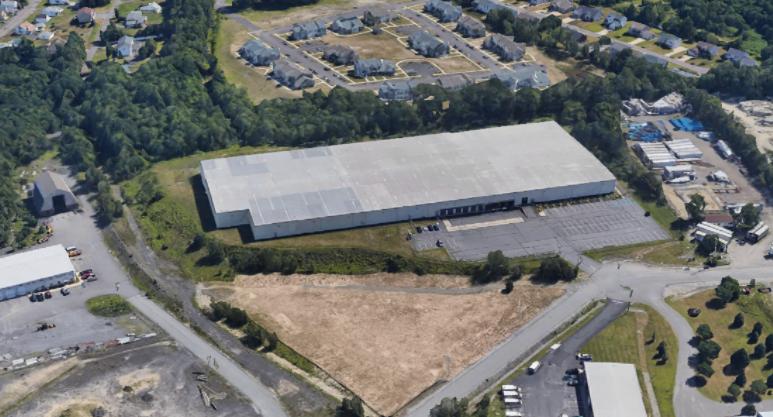
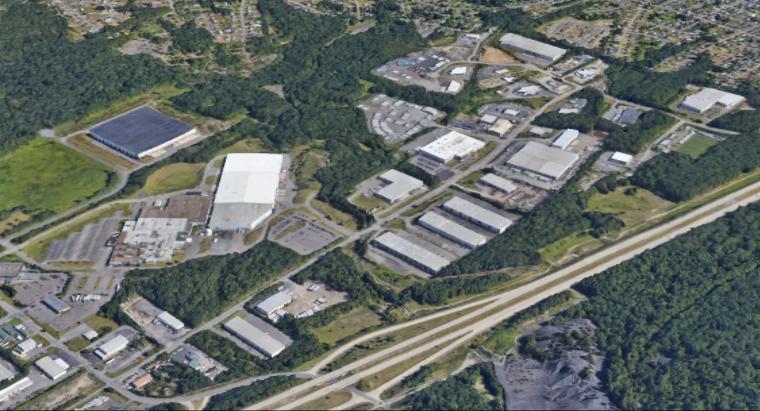
Situated on 8.5 acres within the Mid-Valley Industrial Park is 151,100 SF Multi-tenant Building. Zoned Heavy Industrial. Currently one tenant occupies 48,000SF. Availability of remaining 103,100 SF, beginning Q3 2021.
Highlights:
103,100 SF Available within 151,100 SF Multi-tenant building
Situated on 8.51 acre parcel
Zoned Heavy Industrial
Built 1991 - renovation 1994
Masonry and Steel construction
Reinforced concrete floors
Column spacing - 25'w X 60'd
Ceiling Height - 21' - 24'
8 Dock Doors with availability to add 5-6 more
Truck Court 110'
Parking for 76 cars.
As of 2020 Colts Transit has included a route directly into the industrial park with several stops. Allowing for higher workforce availability.
Lighting - LED
Power - 1,200a480v 3p Heavy
HVAC - gas forced air
Sprinklers - Wet
No part of this information may be copied, reproduced, repurposed, or screen-captured for any commercial purpose without prior written authorization from MyEListing.
While we strive to provide the most accurate information, all listing information, and demographic data, is provided by third-parties. As such, MyEListing will not be responsible for the accuracy of the information. It is strongly recommended that you verify all information with the listing agent, and any relevant agencies, prior to making any decisions.
What is the building size of this Industrial property in Jessup, PA?
The size of the building/unit at 1270 Mid Valley Drive in Jessup is 103,100 square feet
How much land does the Jessup, PA property at 1270 Mid Valley Drive include?
1270 Mid Valley Drive in Jessup includes 8.514 acres of land
What is the population within 1 mile of 1270 Mid Valley Drive in Jessup?
The population within 1 mile of 1270 Mid Valley Drive Jessup, PA 18434 is 4,806 people.
Who do I contact for questions about 1270 Mid Valley Drive?
You should contact the listing agent,
David Weaver, for any details regarding this commercial listing.