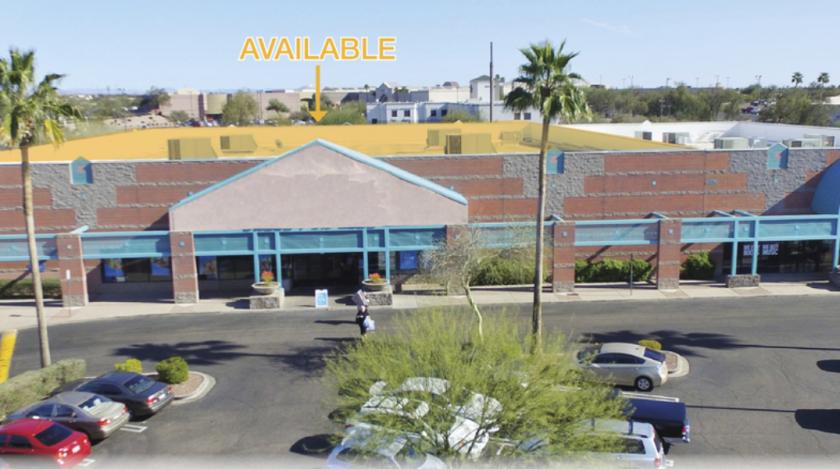
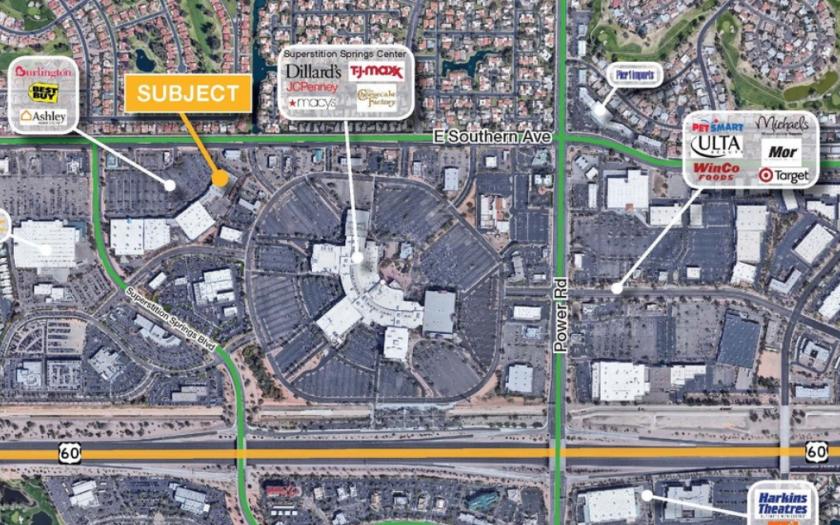
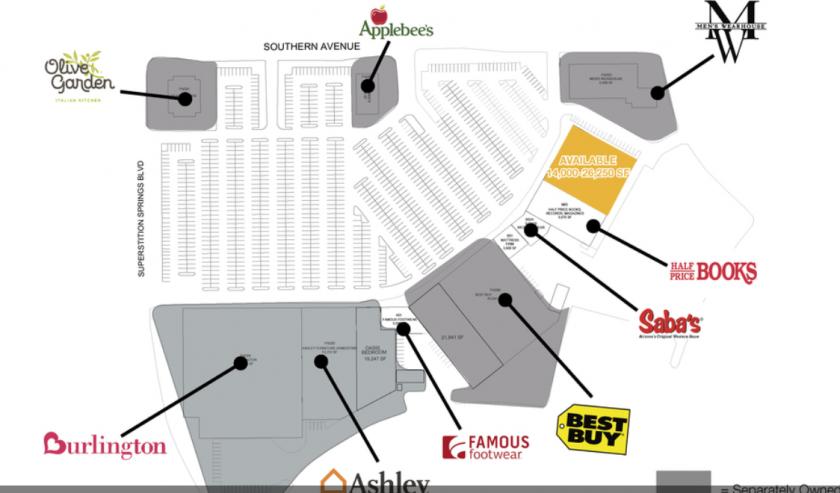
Retail Space
6341 East Southern Avenue Mesa, AZ 85206
6341 East Southern Avenue Mesa, AZ 85206
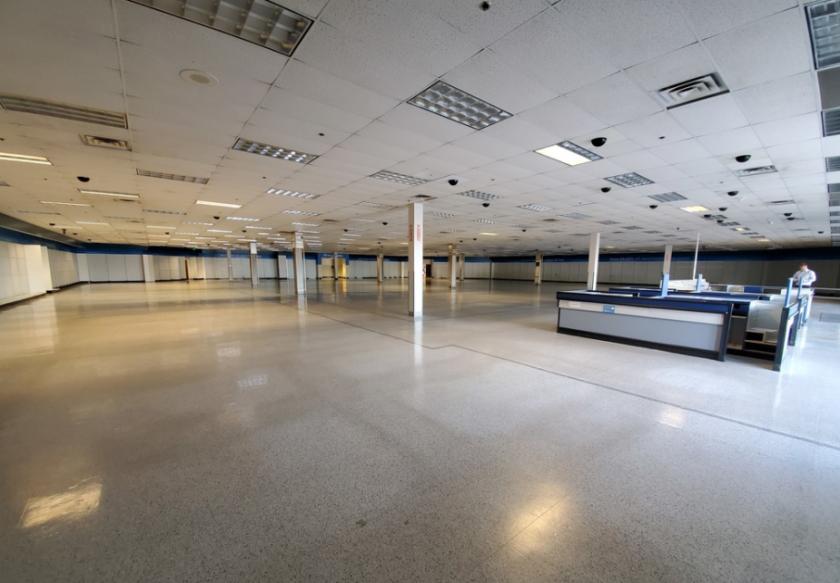
Details & Description
Additional Photos

Listing Agents

Gabe Ortega
O: 602-852-3415
M: 480-213-0861
gabe.ortega@naihorizon.com
O: 602-852-3415
M: 480-213-0861
gabe.ortega@naihorizon.com
While we strive to provide the most accurate information, all listing information, and demographic data, is provided by third-parties. As such, MyEListing will not be responsible for the accuracy of the information. It is strongly recommended that you verify all information with the listing agent, and any relevant agencies, prior to making any decisions.


