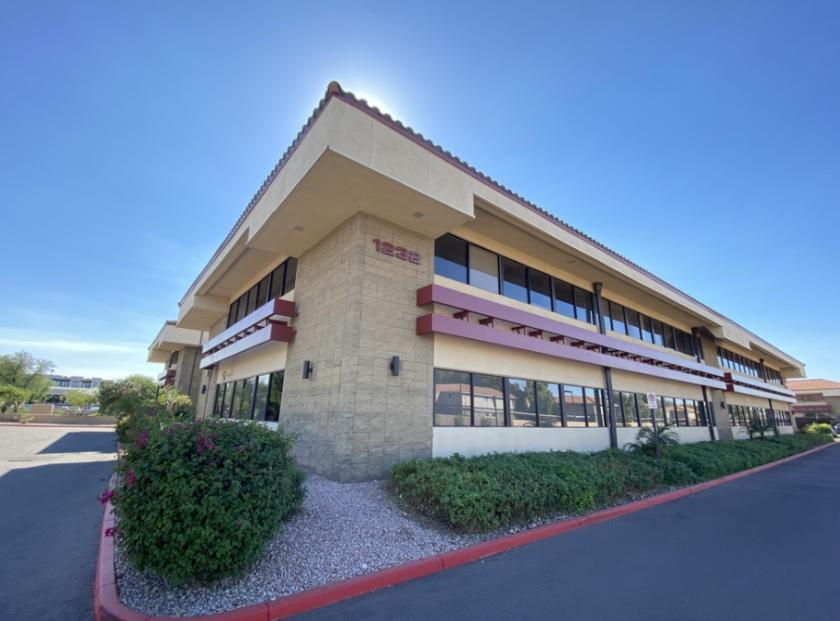
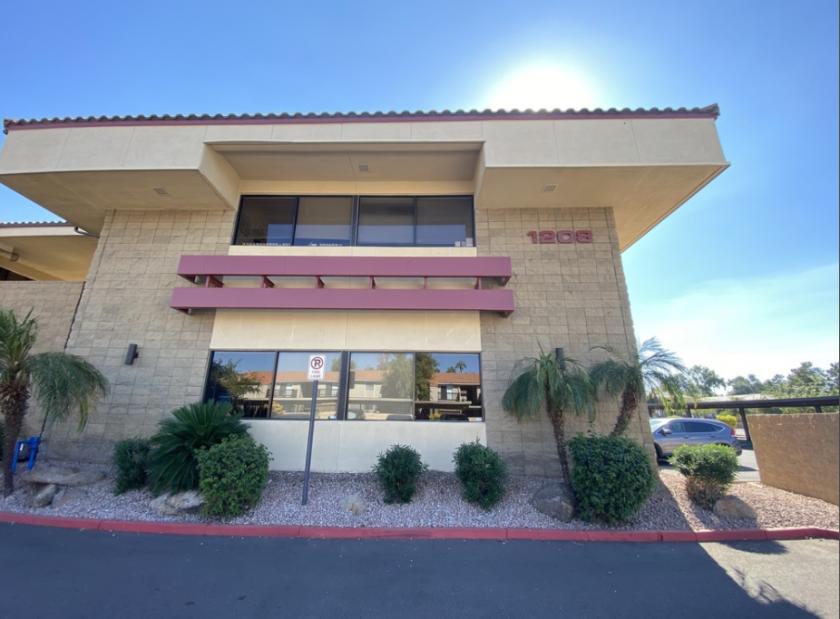
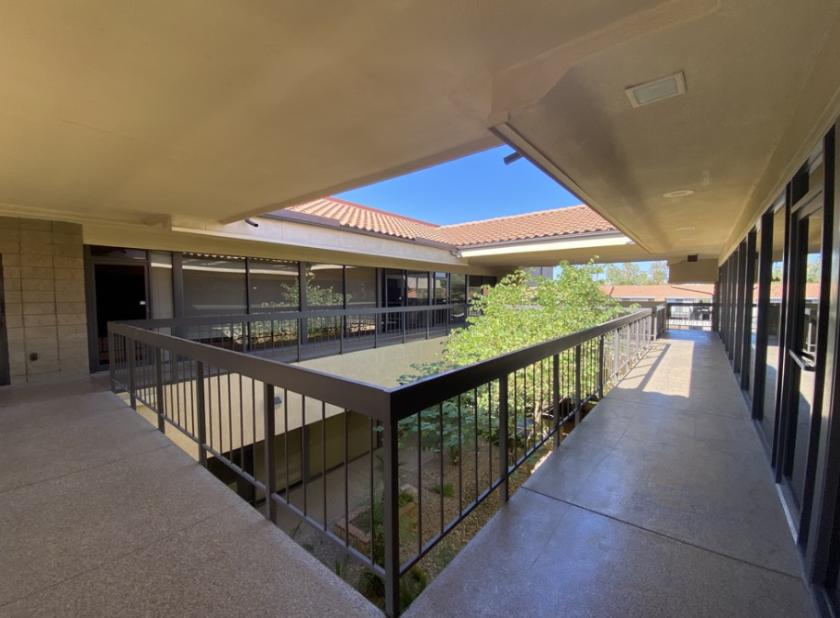
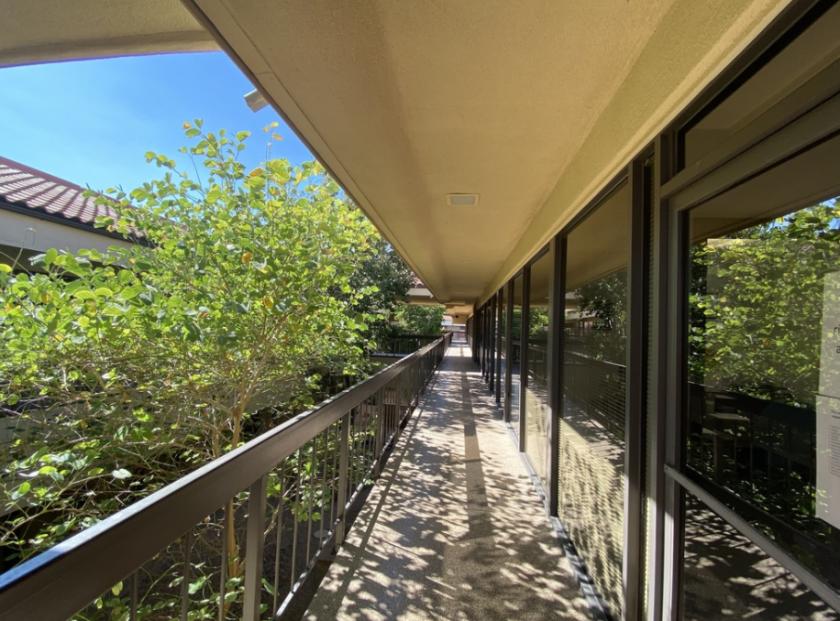
1-Mile | 3-Miles | 5-Miles | ||
---|---|---|---|---|
Total Population | 31,584 | 153,886 | 356,428 | |
Population Median Age | 30 | 33 | 35 | |
Population by Age | 0-9 Yrs | 1889 (5%) | 13430 (8%) | 37733 (10%) |
10-19 Yrs | 5015 (15%) | 21172 (13%) | 44037 (12%) | |
20-29 Yrs | 14343 (45%) | 50552 (32%) | 93065 (26%) | |
30-39 Yrs | 4073 (12%) | 22537 (14%) | 55546 (15%) | |
40-49 Yrs | 1991 (6%) | 13751 (8%) | 37053 (10%) | |
50-59 Yrs | 1789 (5%) | 12219 (7%) | 35840 (10%) | |
60-69 Yrs | 1335 (4%) | 10974 (7%) | 29730 (8%) | |
70+ Yrs | 1150 (3%) | 9252 (6%) | 23424 (6%) | |
Median HH Income | $36,862 | $49,199 | $52,864 | |
Total Household Income | < 24K | 4103 (35%) | 15558 (26%) | 31023 (22%) |
25-49K | 3071 (26%) | 14658 (24%) | 34970 (25%) | |
50-74K | 1627 (14%) | 10854 (18%) | 26513 (19%) | |
75-99K | 1021 (8%) | 7130 (11%) | 17334 (12%) | |
100-199K | 1305 (11%) | 9706 (16%) | 23873 (17%) | |
200K+ | 318 (2%) | 1699 (2%) | 5207 (3%) | |
Highest Education Level | No Diploma | 997 | 7599 | 24404 |
Diploma or GED | 1802 | 14776 | 43544 | |
Some College | 3430 | 23383 | 58834 | |
Assoc. Degree | 980 | 7172 | 18515 | |
Bachelors Degree | 4168 | 21469 | 51148 | |
Higher Degree | 3810 | 15604 | 30411 | |
Total Housing Units | 12,980 | 67,326 | 154,037 | |
--Owner-Occupied | 2,420 | 20,016 | 56,724 | |
--Renter-Occupied | 9,025 | 39,588 | 82,196 | |
Owner-Occupied Values | < 100K | 194 | 2346 | 8050 |
100-199K | 533 | 4985 | 14243 | |
200-299K | 798 | 7454 | 19392 | |
300-399K | 414 | 3472 | 9526 | |
400-499K | 262 | 1001 | 3107 | |
500K+ | 219 | 758 | 2406 | |
Total Working Age Population | 28,963 | 133,805 | 297,987 | |
In Work Force | 17,974 | 91,583 | 209,463 | |
Not In Work Force | 10,989 | 42,222 | 88,524 | |
Workforce Employed | 16,824 | 86,448 | 198,042 | |
Workforce Unemployed | 1,150 | 5,045 | 11,182 | |
Civlian Workforce | 17,974 | 91,494 | 209,224 | |
Military Workforce | 0 | 89 | 238 | |
Total Households | 11,445 | 59,604 | 138,920 | |
Family Households | 3,804 | 25,914 | 69,303 | |
Non-Family Households | 7,641 | 33,690 | 69,617 | |
Married Couple | 2,470 | 15,889 | 42,067 | |
Other Family | 1,334 | 10,025 | 27,236 | |
Married w/Child | 1,019 | 5,991 | 16,131 | |
Single Male w/Child | 213 | 1,469 | 3,759 | |
Single Female w/Child | 272 | 2,630 | 8,476 |
Population Change Last Two Decades - Plus Projection
2000 | % | 2010 | % | 2020 | % | 2030 | |
---|---|---|---|---|---|---|---|
Arizona | 5,130,632 | +25 | 6,392,017 | +14 | 7,286,100 | +14 | 8,284,900 |
Maricopa County | 3,072,149 | +24 | 3,817,117 | +16 | 4,436,900 | +15 | 5,107,700 |
Pinal County | 179,727 | +109 | 375,770 | +24 | 466,200 | +32 | 616,200 |
Total Working Age Population:
Total Households:
Total Working Age Population:
Total Households:
Total Working Age Population:
Total Households: