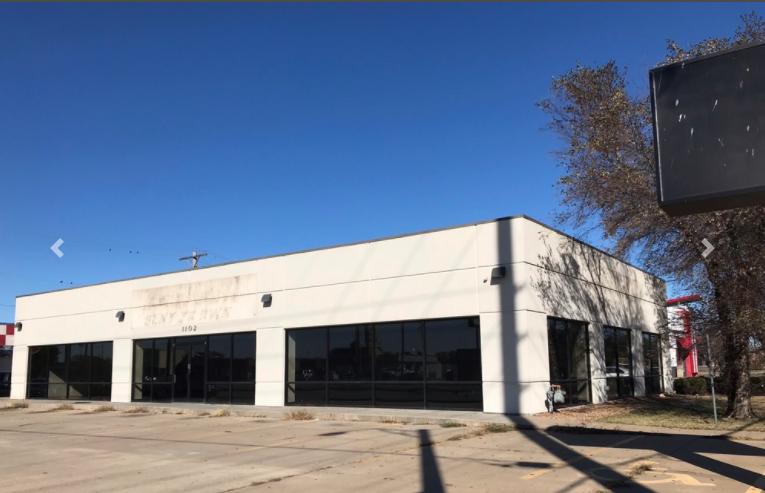
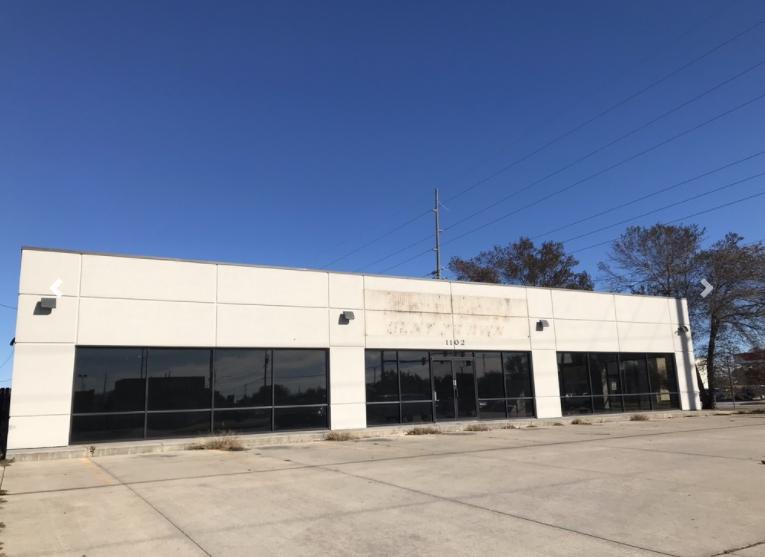
Retail Space
1102 West Pawnee Street Wichita, KS 67213
1102 West Pawnee Street Wichita, KS 67213
Details & Description
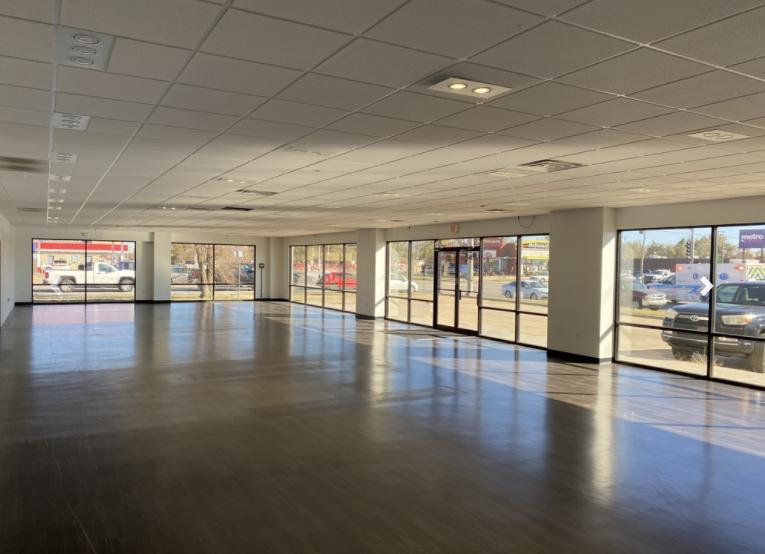
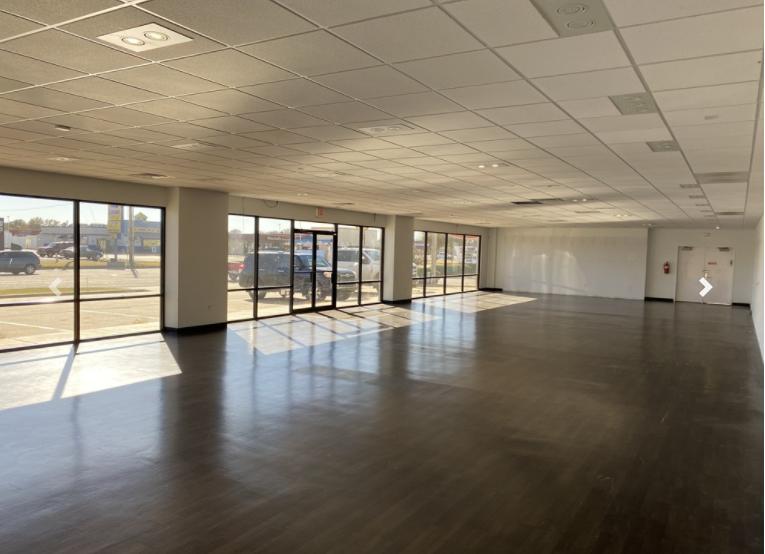
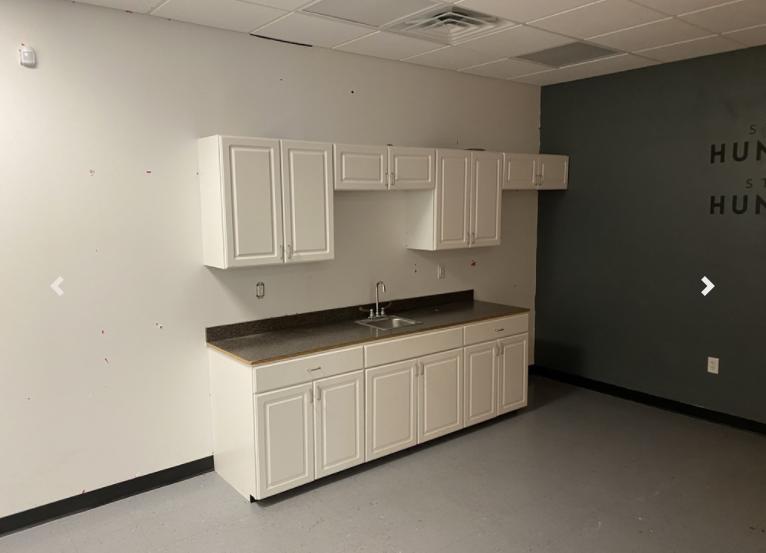
Additional Photos
Listing Agents

Nathan Farha
O: 316-263-9669
M: 316-807-3250
nfarha@naimartens.com
O: 316-263-9669
M: 316-807-3250
nfarha@naimartens.com

Jeff Englert
O: 316-847-4924
M: 316-214-3436
jenglert@naimartens.com
O: 316-847-4924
M: 316-214-3436
jenglert@naimartens.com
While we strive to provide the most accurate information, all listing information, and demographic data, is provided by third-parties. As such, MyEListing will not be responsible for the accuracy of the information. It is strongly recommended that you verify all information with the listing agent, and any relevant agencies, prior to making any decisions.


